
Introduction
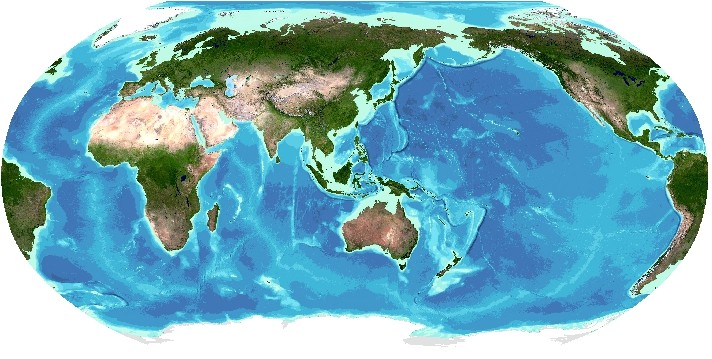
The GEBCO_2025 Grid is a global terrain model for ocean and land, providing elevation data, in meters, on a 15 arc-second interval grid of 43200 rows x 86400 columns, giving 3,732,480,000 data points. The data values are pixel-centre registered i.e. they refer to elevations, in meters, at the centre of grid cells.
The grid can be downloaded as a global file or for user-defined areas in a number of formats.
The data are available to download according to the Terms of Use.
The grid is accompanied by a Type Identifier (TID) Grid, giving information on the types of source data that the GEBCO_2025 Grid is based on.
The primary GEBCO_2025 grid contains land and ice surface elevation information. A version is also made available with under-ice topography/bathymetry information for Greenland and Antarctica.
The grid was published in August 2025 and is the seventh GEBCO grid developed through The Nippon Foundation-GEBCO Seabed 2030 Project. This is a collaborative project between the Nippon Foundation of Japan and GEBCO. The Seabed 2030 Project aims to bring together all available bathymetric data to produce the definitive map of the world ocean floor and make it available to all.
The GEBCO_2025 Grid includes data sets from a number of international and national data repositories and regional mapping initiatives.
Grid development
The grid uses as a ‘base’ Version 2.7 of the SRTM15+ data set [Tozer et al 2019] largely between latitudes of 50° South and 60° North. This data set is a fusion of land topography with measured and estimated seafloor topography.
The SRTM15+ base grid has been augmented with the gridded bathymetric data sets developed by the four Seabed 2030 Regional Centers to produce the GEBCO_2025 Grid.
The Regional Centers have compiled gridded bathymetric data sets, largely based on multibeam data, for their areas of responsibility. These regional grids were then provided to the Global Center.
For areas outside of the polar regions (primarily south of 60°N and north of 50°S), these data sets are in the form of 'sparse grids', i.e. only grid cells that contain data were populated. For the polar regions, complete grids were provided due to the complexities of incorporating data held in polar coordinates.
The compilation of the GEBCO_2025 Grid from these regional grids was carried out at the Global Center, with the aim of producing a seamless global terrain model.
The sparse regional grids have been included on to the base grid using a ‘remove-restore’ blending procedure (Smith and Sandwell, 1997; Becker, Sandwell and Smith, 2009 and Hell and Jakobsson, 2011). This is a two-stage process of computing the difference between the new data and the ‘base’ grid and then gridding the difference and adding the difference back to the existing ‘base’ grid. The aim is to achieve a smooth transition between the 'new' and 'base' data sets with the minimum of perturbation of the existing base data set.
For the polar data sets supplied in the form of complete grids these data sets were included using feather blending techniques from Global Mapper software version 23.0.1 from Blue Marble Geographics.
Some additional edits were made to the final grid to remove erroneous values identified in the previous grid releases.
Ice-surface elevation and under-ice topography
The GEBCO_2025 grid is made available in two versions, containing:
• land and ice surface elevation information
• under-ice topography information for Greenland and Antarctica
The information for ice-surface elevation and under-ice topography/bathymetry is taken from IceBridge BedMachine Greenland, Version 5 (Morlighem, M. et al. 2017) and data based on MEaSUREs BedMachine Antarctica, Version 2 (Morlighem, M. et al 2020).
Land Data
The land data in the GEBCO Grid are taken directly from SRTM15+ V2.7 data set for all areas outside the Polar regions – see the SRTM15_plus data set documentation for more information.
South of 60°S, the land/ ice-surface elevation topography is largely determined from MEaSUREs BedMachine Antarctica, Version 2 (Morlighem, M. et al 2020). For areas north of 60°N, land data are largely taken from the Global Multi-resolution Terrain Elevation Data 2010 (GMTED2010) data set (Danielson, J.J., and Gesch, D.B., 2011). For the Svalbard region, land data are taken from Terrengmodell Svalbard (S0 Terrengmodell), Norwegian Polar Institute (2014). A list of data sources is given on GEBCO’s web site.
Data set reference
GEBCO Compilation Group (2025) GEBCO 2025 Grid (doi:10.5285/37c52e96-24ea-67ce-e063-7086abc05f29)
GEBCO Type Identifier (TID) Grid
The GEBCO Grid is accompanied by a Type Identifier (TID) grid. This data set identifies the type of source data that the corresponding grid cells in the GEBCO Grid are based on. Further information about the format and coding of the TID grid is given below.
TID | Definition |
|---|---|
| 0 | Land |
| Direct measurements | |
| 10 | Singlebeam - depth value collected by a single beam echo-sounder |
| 11 | Multibeam - depth value collected by a multibeam echo-sounder |
| 12 | Seismic - depth value collected by seismic methods |
| 13 | Isolated sounding - depth value that is not part of a regular survey or trackline |
| 14 | ENC sounding - depth value extracted from an Electronic Navigation Chart (ENC) |
| 15 | Lidar - depth derived from a bathymetric lidar sensor |
| 16 | Depth measured by optical light sensor |
| 17 | Combination of direct measurement methods |
| Indirect measurements | |
| 40 | Predicted based on satellite-derived gravity data - depth value is an interpolated value guided by satellite-derived gravity data |
| 41 | Interpolated based on a computer algorithm - depth value is an interpolated value based on a computer algorithm (e.g. Generic Mapping Tools) |
| 42 | Digital bathymetric contours from charts - depth value taken from a bathymetric contour data set |
| 43 | Digital bathymetric contours from ENCs - depth value taken from bathymetric contours from an Electronic Navigation Chart (ENC) |
| 44 | Depth value at this location is based on bathymetric depths from multiple sources including measured and derived data and included within a gridded data set where interpolation between sounding points is guided by satellite-derived gravity data |
| 45 | Predicted based on helicopter/flight-derived gravity data |
| 46 | Depth estimated by calculating the draft of a grounded iceberg using satellite-derived freeboard measurement. |
| 47 | Depth derived from grounded Argo float data |
| 48 | Depth measured by animal-borne data loggers |
| Unknown | |
| 70 | Pre-generated grid - depth value is taken from a pre-generated grid that is based on mixed source data types, e.g. single beam, multibeam, interpolation etc. |
| 71 | Unknown source - depth value from an unknown source |
| 72 | Steering points - depth value used to constrain the grid in areas of poor data coverage |
GEBCO Grid, vertical and horizontal datum
The complete GEBCO_2025 data set provides global coverage, spanning 89° 59' 52.5''N, 179° 59' 52.5''W to 89° 59' 52.5''S, 179° 59' 52.5''E on a 15 arc-second geographic latitude and longitude grid. It consists of 43200 rows x 86400 columns, giving 3,732,480,000 data points. The data values are pixel-centre registered i.e. they refer to elevations, in meters, at the centre of grid cells.
The GEBCO grid can be assumed to be relative to WGS84.
GEBCO's global elevation models are generated by the assimilation of heterogeneous data types, assuming all of them to be referred to Mean Sea Level. However, in some shallow water areas, the grids include data from sources having a vertical datum other than mean sea level.
Data Dissemination
CF-compliant NetCDF format
The GEBCO_2025 NetCDF files are provided in NetCDF 4 format and conform to the NetCDF Climate and Forecast (CF) Metadata Convention v1.6 (http://cfconventions.org/).
Within the NetCDF files, the GEBCO_2025 gridded data are stored as a two-dimensional array of 2-byte integer values of elevation in metres, with negative values for bathymetric depths and positive values for topographic heights. The GEBCO_2025 TID grid is provided in the NetCDF format, but data are stored as a two-dimensional array of single byte integers.
- The global dataset is provided as a single 7.5 GB file
- The global TID grid is provided as a single 4 GB file
Data set attribution
If the data sets are used in a presentation or publication then we ask that you acknowledge the source. This should be of the form:
GEBCO Compilation Group (2025) GEBCO 2025 Grid (doi:10.5285/ 37c52e96-24ea-67ce-e063-7086abc05f29)
Terms of use and disclaimer
Scope
- These terms of use apply to The GEBCO Grid and other GEBCO-derived information products
- For brevity ‘The GEBCO Grid’ is used throughout and should be interpreted as meaning The GEBCO Grid and other GEBCO-derived information products
- Bathymetric Data refers to measurements made by various instruments of the ocean depth, associated ocean properties and the supporting metadata
- Information products are the result of applying algorithms, mathematical techniques, scientific theory and Intellectual Property to data to create useful, derived values
- As the GEBCO Grid is created by interpolating, applying algorithms and mathematical techniques to bathymetric data, GEBCO considers the GEBCO Grid to be an information product
- GEBCO does not provide the underlying source bathymetric data when distributing the GEBCO Grid
Terms of use
The GEBCO Grid is placed in the public domain and may be used free of charge.
Use of the GEBCO Grid indicates that the user accepts the conditions of use and disclaimer information given below.
Users are free to:
- Copy, publish, distribute and transmit The GEBCO Grid
- Adapt The GEBCO Grid
- Commercially exploit The GEBCO Grid, by, for example, combining it with other information, or by including it in their own product or application
Users must:
- Acknowledge the source of The GEBCO Grid. A suitable form of attribution is given in the documentation that accompanies The GEBCO Grid.
- Not use The GEBCO Grid in a way that suggests any official status or that GEBCO, or the IHO or IOC, endorses any particular application of The GEBCO Grid.
- Not mislead others or misrepresent The GEBCO Grid or its source.
Disclaimer
- The GEBCO Grid should NOT be used for navigation or for any other purpose involving safety at sea.
- The GEBCO Grid is made available 'as is'. While every effort has been made to ensure reliability within the limits of present knowledge, the accuracy and completeness of The GEBCO Grid cannot be guaranteed. No responsibility can be accepted by GEBCO, IHO, IOC, or those involved in its creation or publication for any consequential loss, injury or damage arising from its use or for determining the fitness of The GEBCO Grid for any particular use.
- The GEBCO Grid is based on bathymetric data from many different sources of varying quality and coverage.
- As The GEBCO Grid is an information product created by interpolation of measured data, the resolution of The GEBCO Grid may be significantly different to that of the resolution of the underlying measured data.
Reporting bugs in the GEBCO Grid
While every effort is made to produce an error- free grid, some artefacts may still appear in the data set. Please see our errata page for information on known bugs in the dataset.
If you find any anomalies in the grid then please report them via email ( gdacc@seabed2030.org ), giving the problem location, and we will investigate.
References
Becker, J J, D T Sandwell, W H F Smith, J Braud, B Binder, J Depner, D Fabre, J. Factor, S Ingalls, S-H Kim, R Ladner, K Marks, S Nelson, A Pharaoh, R Trimmer, J Von Rosenberg, G Wallace, P Weatherall (2009). Global Bathymetry and Elevation Data at 30 Arc Seconds Resolution: SRTM30_PLUS, Marine Geodesy, 32:4, 355-371.
Dorschel, B. et al. The International Bathymetric Chart of the Southern Ocean Version 2. Scientific Data 9, 275, https://doi.org/10.1038/s41597-022-01366-7 (2022).
Danielson, J.J., and Gesch, D.B., 2011, Global multi-resolution terrain elevation data 2010 (GMTED2010): U.S. Geological Survey Open-File Report 2011–1073, 26 p.
Fretwell, P, H D Pritchard D G Vaughan, J L Bamber, N E Barrand, R Bell, C. Bianchi, R G Bingham, D D Blankenship, G Casassa, G Catania, D Callens, H Conway, A J Cook, H F J Corr, D Damaske,V Damm, F Ferraccioli, R Forsberg, S Fujita, Y Gim, P Gogineni, J A Griggs, R C A Hindmarsh, P Holmlund, J W Holt, R W Jacobel, A Jenkins, W Jokat, T Jordan, E C King, J Kohler, W Krabill, M Riger-Kusk, K A Langley, G Leitchenkov, C Leusche, B P Luyendyk, K Matsuoka, J Mouginot,F O Nitsche, Y Nogi, O A Nost, S V Popov, E Rignot, D M Rippin, A Rivera, J Roberts, N Ros, M J Sieger, A M Smith, D Steinhage, M Studinger, B Sun, B K Tinto, B C Welch, D Wilson, D A Young, C Xiangbin and A Zirizzotti (2013). Bedmap2: improved ice bed, surface and thickness datasets for Antarctica, The Cryosphere, 7, 375-393, 2013, doi.org/10.5194/tc-7-375-2013.
Gevorgian, J., Sandwell, D. T., Yu, Y., Kim, S. S., & Wessel, P. (2023). Global distribution and morphology of small seamounts. Earth and Space Science, 10(4), e2022EA002331
Harper, Hugh & Sandwell, David. (2024). Global Predicted Bathymetry Using Neural Networks. Earth and Space Science. 11. 10.1029/2023EA003199.
Hébert, H., Deplus, C., Huchon, P., et al (2001). Lithospheric structure of a nascent spreading ridge inferred from gravity data: The western Gulf of Aden. Journal of Geophysical Research, 106(B1126), 345363–345426.
Hell, B and M Jakobsson (2011), Gridding heterogeneous bathymetric data sets with stacked continuous curvature splines in tension, Mar. Geophys. Res., 32(4), 493-501, doi:10.1007/s11001-011-9141-1.
Jakobsson, M., Mayer, L.A., Bringensparr, C. et al. The International Bathymetric Chart of the Arctic Ocean Version 4.0. Scientific Data 7, 176 (2020). https://doi.org/10.1038/s41597-020-0520-9
Loubrieu, B. (2019a). Bathymetry - Kerguelen Islands (synthesis, 2019) cell size 200 m. Ifremer. https://doi.org/10.12770/1909f2fb-09ee-49e3-8b5f-52b12e53d292
Loubrieu, B. (2019b). Bathymetry of the French Guiana margin and Demerara plateau/data compilation, Ifremer. https://doi.org/10.12770/1f127956-8350-466e-b795-c8a9eb3c218e
Loubrieu, B., Jean-Yves, R., & Marcia, M. (2020). Bathymetry around Saint-Paul and Amsterdam islands/data compilation 2020, Ifremer. https://doi.org/10.12770/342b2892-b0de-4566-bd77-520fb3bf4eaa
Mayer, Larry & Jakobsson, Martin & Allen, Graham & Dorschel, Boris & Falconer, Robin & Ferrini, Vicki & Lamarche, Geoffroy & Snaith, Helen & Weatherall, Pauline. (2018). The Nippon Foundation-GEBCO Seabed 2030 Project: The Quest to See the World's Oceans Completely Mapped by 2030. Geosciences. 8. 63. 10.3390/geosciences8020063.
Morlighem, M., C. Williams, E. Rignot, L. An, J. E. Arndt, J. Bamber, G. Catania, N. Chauché, J. A. Dowdeswell, B. Dorschel, I. Fenty, K. Hogan, I. Howat, A. Hubbard, M. Jakobsson, T. M. Jordan, K. K. Kjeldsen, R. Millan, L. Mayer, J. Mouginot, B. Noël, C. O'Cofaigh, S. J. Palmer, S. Rysgaard, H. Seroussi, M. J. Siegert, P. Slabon, F. Straneo, M. R. van den Broeke, W. Weinrebe, M. Wood, and K. Zinglersen. 2017. BedMachine v3: Complete bed topography and ocean bathymetry mapping of Greenland from multi-beam echo sounding combined with mass conservation, Geophysical Research Letters. 44. . https://doi.org/10.1002/2017GL074954
Morlighem, M., E. Rignot, T. Binder, D. D. Blankenship, R. Drews, G. Eagles, O. Eisen, F. Ferraccioli, R. Forsberg, P. Fretwell, V. Goel, J. S. Greenbaum, H. Gudmundsson, J. Guo, V. Helm, C. Hofstede, I. Howat, A. Humbert, W. Jokat, N. B. Karlsson, W. Lee, K. Matsuoka, R. Millan, J. Mouginot, J. Paden, F. Pattyn, J. L. Roberts, S. Rosier, A. Ruppel, H. Seroussi, E. C. Smith, D. Steinhage, B. Sun, M. R. van den Broeke, T. van Ommen, M. van Wessem, and D. A. Young. 2020. Deep glacial troughs and stabilizing ridges unveiled beneath the margins of the Antarctic ice sheet, Nature Geoscience. 13. 132-137. https://doi.org/10.1038/s41561-019-0510-8
Norwegian Polar Institute (2014). Terrengmodell Svalbard (S0 Terrengmodell) [Data set]. Norwegian Polar Institute. https://doi.org/10.21334/npolar.2014.dce53a47
Olson, C. J., Becker, J. J. and Sandwell, D T (2014). A new global bathymetry map at 15 arcsecond resolution for resolving seafloor fabric: SRTM15_PLUS, AGU Fall Meeting Abstracts 2014.
Ruellan, E. North Fiji basin (Southwest Pacific) - 1000m. Ifremer. https://doi.org/10.12770/f651de98-9478-4d42-9dc9-c0ec7a43ae87
Sandwell, D T., R D Müller, W H F Smith, E Garcia, R Francis (2014). New global marine gravity model from CryoSat-2 and Jason-1 reveals buried tectonic structure, Science, Vol. 346, no. 6205, pp. 65-67, doi: 10.1126/science.1258213.
Sandwell, D.T., Harper, H., Tozer, B. and Smith, W.H., 2019. Gravity field recovery from geodetic altimeter missions. Advances in Space Research.
Sauter, D., & Mendel, V. (2000). The Southwest Indian ridge between 65°E and 68°E-120m. Ifremer. https://doi.org/10.12770/e54561cf-a7aa4336-a935-7cfec6e1cdbb
Sisavath, E., Babonneau, N., Saint-Ange, F., Bachèlery, P., Jorry, S. J., Deplus, C., et al. (2011). Morphology and sedimentary architecture of a modern volcaniclastic turbidite system: The Cilaos fan, offshore La Réunion Island. Marine Geology, 288(1–4), 1–17. https://doi.org/10.1016/j.margeo.2011.06.011
Smith, W H F and D T Sandwell (1997). Global seafloor topography from satellite altimetry and ship depth soundings, Science, v. 277, p. 1957-1962, 26 Sept.
Talbot, S., & Loubrieu, B. Retrieved from https://w3.ifremer.fr/archimer/doc/00613/72480/https://sextant.ifremer…
Tozer, B, Sandwell, D. T., Smith, W. H. F., Olson, C., Beale, J. R., & Wessel, P. (2019). Global bathymetry and topography at 15 arc sec: SRTM15+. Earth and Space Science. 6. https://doi.org/10.1029/2019EA000658.