
The oceans cover more than two thirds of the world's surface. For over one hundred years GEBCO has been involved in producing maps and digital data sets of this terrain.
Find out more about GEBCO, our data sets and products, and how ocean depths (bathymetry data) are measured, collected and used.
About GEBCO
- What is GEBCO and what do we do?
- What is the Nippon Foundation-GEBCO Seabed 2030 Project?
- GEBCO's data sets and products
- GEBCO's grids and vertical datum
- How can I access GEBCO's data sets?
- How can I contribute data?
- What is crowdsourced bathymetry?
Bathymetry data (ocean depths)
- What is bathymetry?
Mapping the ocean floor
- Why do we need to measure depths in the oceans?
- How much of the ocean floor has been mapped?
How do you measure depths?
- Acoustic methods — using sound waves
- 'Measuring' bathymetry from space, why and how
How are maps of the ocean floor made?
- Creating a bathymetric grid
- Using bathymetric soundings and satellite-derived gravity data to create a bathymetric grid
- What does map and data set 'resolution' mean?
- what are grid artifacts
- How can we know what areas show measured depths of the seabed and what areas are 'predicted' depths?
Useful links for further information on bathymetry data and projects studying our oceans
Find out more about GEBCO
What is GEBCO and what do we do?
GEBCO is an acronym for the General Bathymetric Chart of the Oceans. We are an international group of geoscientists and hydrographers who work on the development of a range of bathymetric data sets and data products. Our aim is to provide the most authoritative publicly-available bathymetry of the world's oceans.
GEBCO operates under the joint auspices of the Intergovernmental Oceanographic Commission (IOC) (of UNESCO) and the International Hydrographic Organization (IHO).
Our work is directed by a Guiding Committee and supported by sub-committees on ocean mapping and undersea feature names plus ad hoc working groups.
Access the GEBCO Strategy 2024 - 2030 to find out more about GEBCO's vision and mission.
GEBCO Strategy 2024 - 2030 - full resolution (11 MB)
GEBCO Strategy 2024 - 2030 - lower resolution (2 MB)
We are involved in training a new generation of scientists in bathymetric mapping through the GEBCO/Nippon Foundation training programme.
Prince Albert I of Monaco initiated the first GEBCO chart series at the beginning of the 20th century. More information about the early years of GEBCO can be found in the History of GEBCO book.
What is The Nippon Foundation-GEBCO Seabed 2030 Project?
The Nippon Foundation-GEBCO Seabed 2030 project was launched in June 2017 with aim to facilitate the complete mapping of the global ocean floor by the year 2030.
In the opening address of the Forum for Future Ocean Floor Mapping in 2016, Mr. Sasakawa, Chairman of The Nippon Foundation, set forth the initiative to partner with GEBCO to cooperatively work towards mapping 100% of the topography of the World Ocean floor by 2030.
This initiative led to the formulation of Seabed 2030, a global project within the IHO-IOC GEBCO framework with the focused goal of producing the definitive, high-resolution bathymetric map of the entire World Ocean.
This ambitious initiative is driven by a strong motivation to empower the world to make policy decisions, use the ocean sustainably and undertake scientific research based on detailed bathymetric information of the Earth’s seabed.
Find out how to get involved.
GEBCO's data sets and products
GEBCO makes available a range of bathymetric data sets and products. Find out more
- Global grid files- access GEBCO's latest global bathymetric grid
- GEBCO Gazetteer of Geographic Names of Undersea Features
- GEBCO world map
GEBCO's grids and vertical datum
GEBCO's global elevation models are generated by the assimilation of heterogeneous data types assuming all of them to be referred to mean sea level. However, in some shallow water areas, the grids include data from sources having a vertical datum other than mean sea level. We are working to understand how best to fully assimilate these data.
GEBCO's grids are not to be used for navigation or for any other purpose involving safety at sea.
How can I access GEBCO's data sets?
GEBCO's gridded data sets can be downloaded via the internet. Select to download the complete global grid files or data for a user-defined area. Find out more about the grids and how to access the data.
The grids are made available in netCDF and can be downloaded for user-defined areas in data GeoTiff and Esri ASCII raster.
GEBCO's grids are also made available as Web Map Services.
GEBCO makes available a global data set of geographic names of undersea features. It is maintained and updated through the work of the GEBCO Sub-Committee on Undersea Feature Names (SCUFN). The gazetteer is available to download from the web along with information about how to submit name proposals for newly-discovered features on the seafloor.
The GEBCO world map shows the bathymetry of the world's ocean floor in the form of a shaded relief colour map. It can be accessed from the web in JPEG form.
How can I contribute data?
GEBCO is continually working to improve its gridded data sets with the aim of providing the most authoritative publicly-available bathymetric grids for the world’s oceans.
We are grateful for contributions of single-beam and/or multibeam survey data, individual soundings or existing grids to help update our gridded data sets and products. We acknowledge the source of contributed data in the documentation which accompanies GEBCO's data sets.
Use our online form to let us know about data sets that you can contribute to help update the GEBCO grid.
Crowdsourced Bathymetry
Crowdsourced bathymetry (CSB) is the collection of bathymetry data from vessels, using standard navigation instruments, while engaged in routine maritime operations. CSB can be used to supplement the more rigorous and scientific bathymetric coverage done by hydrographic offices, industry, and researchers around the world.
The IHO Inter-Regional Coordinating Committee has established a Crowdsourced Bathymetry Working Group (CSBWG) to examine how best to incorporate, manage and use bathymetric data collected by other than conventional means.
Find out how you can get involved through CSB information leaflets at the IHO's web site.
Find out more about the IHO Crowdsourced Bathymetry Initiative from the IHO DCDB's web site.
Bathymetry data (ocean depths)
What is bathymetry?
Bathymetry is the study or representation of the land or other solid surface beneath a layer of liquid. As such, bathymetry can include the depths of oceans and lakes.
GEBCO's focus is on the bathymetry of the world's oceans.
Information is given below about how bathymetry data are measured and used to produce bathymetric maps and grids.
Mapping the ocean floor
Why do we need to measure depths in the oceans?
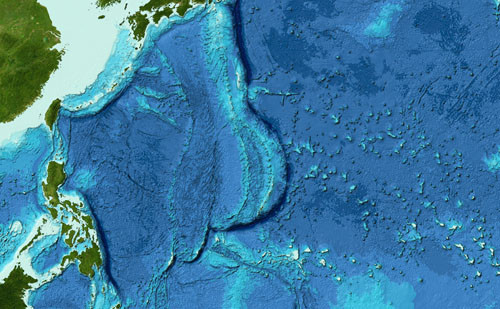
The oceans cover nearly two thirds of the earths surface and have a great influence on our climate and our everyday lives. Far below the ocean's surface, the ocean floor is a varied terrain consisting of deep trenches and long mountain chains — formed by the geological processes that shape the Earth.
This terrain helps to steer ocean currents and influences circulation and mixing patterns that in turn affect our climate and influences hazards facing coastal communities (like approaching tsunamis).
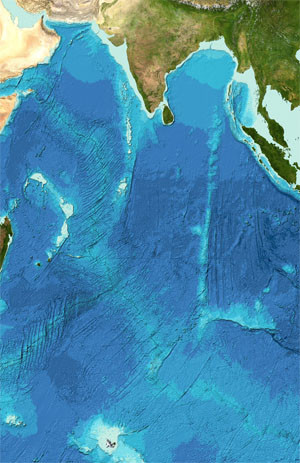
The image below shows the curving feature of the Mariana Trench, which includes the deepest part of the oceans.
In shallower water regions, an accurate knowledge of seafloor depths is important for navigational purposes and for warnings of hazards to shipping. It is also important for offshore resource exploration and exploitation (such as fisheries and hydrocarbons), hazardous waste disposal, and for general marine spatial planning such as for Marine Protected Areas and Marine Conservation Zones. The ocean floor also holds a reservoir of natural resources such as oil and gas.
Access information from Seabed 2030's web site on use cases highlighting the critical importance of seabed mapping across key sectors such as climate change, biodiversity, and the Blue Economy.
How much of the ocean floor has been mapped?
In the image below, areas shown in blue are based on measured data or pre-generated grids and the areas in black are based on interpolation.
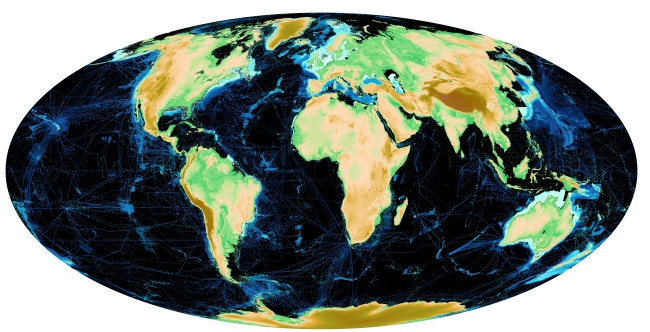
The Nippon Foundation-GEBCO Seabed 2030 Project aims to map the global seafloor by 2030. The method that Seabed 2030 is using to determine the coverage, and progress to date, is given on the Mapping Progress page on the Seabed 2030 web site.
The BathyGlobe tool at the Center for Coastal and Ocean Mapping's (CCOM) web site shows those areas of the ocean that have been accurately mapped using the technology of multibeam echo-sounders.
How do you measure depths in the ocean?
Bathymetry data was first collected in the deep oceans in the middle of the 19th century using simple plumb-lines (weighted twine or rope), marked at regular intervals to give the depth.
The introduction of acoustic measuring systems (single-beam echo-sounders) in the 1930s led to a huge increase in the volume of data collected. Today, multi-beam echo-sounder systems can map swathes of the ocean floor, collecting large volumes of data.
'The History of GEBCO, 1903-2003' book provides information about the early days of bathymetric mapping.
To store the increasing volumes of digital bathymetry data being collected and to make this generally available, the IHO setup the Data Center for Digital Bathymetry (IHO DCDB) in 1990.The Centre archives and shares, freely and without restrictions, depth data contributed by mariners and is hosted by the U.S. National Oceanic and Atmospheric Administration (NOAA) on behalf of the IHO Member States.
The image below shows some of the coverage of ship-track data held in the IHO DCDB.
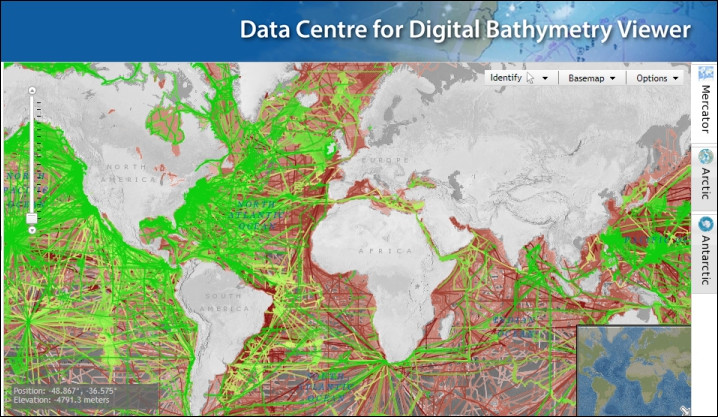
Even with the increase in the volumes of bathymetry data, there are still large areas of the ocean floor that have not been fully surveyed. Data are often concentrated along isolated ship tracks and there may be many miles between tracks.
In areas of sparse sounding data coverage, satellite altimetry data can help us map the ocean floor. This measures the height of the sea surface. Small variations in sea height can be related to changes in the earth's gravity field. This in turn can be related to the shape of features on the ocean floor. Find out more.
Acoustic methods — using sound waves
These systems measure broad swathes of the seabed (up to 10 kilometers across in very deep water) to accuracies of better than a metre or two. Very high accuracy systems measure narrower swathes and shallower water but have a depth accuracy of up to a couple of centimetres.
Since the early 20th century the ocean depths have been mapped using acoustic methods, i.e. using sounding waves.
This is done by sending a sound pulse from a vessel and listening until the echo from the seabed is heard. The depth is then found by dividing the speed of sound (approximately 1,500 meters per second) by half of the time it takes for the echo to be heard (recorded). We use half the time as the total time would include the time from the ship to seabed and back again, and we just want to find the one-way distance.
These early depth measuring systems give the depth at a single point, usually below the keel of the vessel, and are called single-beam echo-sounders.
Below you can see the theory of a single-beam echo-sounder.
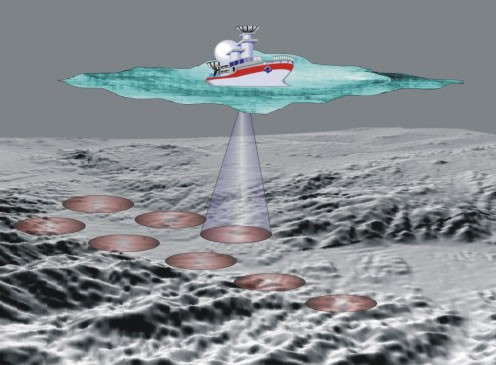
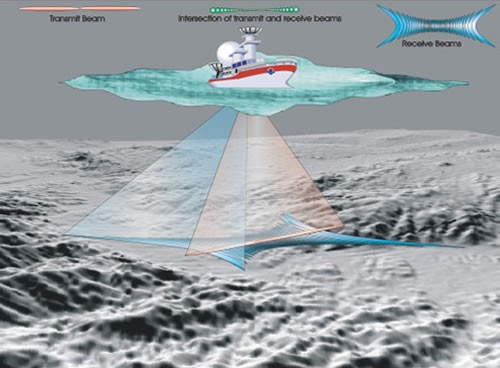
From the late 1970’s onward, multibeam bathymetric mapping has become more and more common. This differs from single-beam acoustic soundings in that a 'swath' of sound is transmitted below and to either side of the survey vessel. This means that rather than a series of points being recorded just below the vessel as seen in the picture above, a swath or broad corridor of the seabed is mapped. The depths across this corridor are automatically logged onto a computer for data processing, cleaning and ultimately map making.
The image below shows the theory of multibeam or swath bathymetric mapping systems — note that they give a complete picture of the seabed rather than the series of single points of a single-beam echo-sounder.
Information about how single-beam and multibeam echo-sounders operate can be found at the Woods Hole Oceanographic Institution's web site.
An important component of measuring depth is positional information for the soundings, i.e. recording the longitude and latitude of where the soundings were measured. There have been great advances from the early days of recording positional information from astronomical observations to radio navigation and then to the present day and systems such as the Global Positioning System (GPS) which can record positions to within a few metres.
Errors in position information can be one of the causes of errors or 'artifacts' in bathymetric maps.
'Measuring' bathymetry from space
Why 'measure' bathymetry from space?
The world’s oceans are vast and it would take many years to systematically survey the global ocean floor using single-beam or multibeam echo-sounders. It has been estimated that a systematic survey of the oceans by ships would take more than 200 years of survey time at a cost of billions of U.S. dollars.
Using satellite-derived gravity data can help with mapping work in regions of sparse ship-track sounding data coverage. Although the satellites cannot 'see' the ocean floor they can observe gravity anomalies which can be correlated with ocean floor topography.
The process involved and advantages and limitations of 'measuring' bathymetry from space are discussed below.
How is bathymetry 'measured' from space
The following explanation and figures are excerpts taken from a report entitled 'Bathymetry from Space', a summary of a workshop held in La Jolla, California in October 2002. The full citation for the report appears at the end of these paragraphs.
The ocean’s surface has broad bumps and dips that mimic the topography of the ocean floor. The extra gravitational attraction of seafloor features such as seamounts produces minor variations in gravity, which in turn produce tiny variations in ocean surface height. As tiny as they may seem, these bumps and dips can be mapped using a very accurate radar altimeter mounted on a satellite. In the deep ocean basins, where sediments are thin and seabed geology is simple, space radar data may be used to predict bathymetry. See the following pictures.
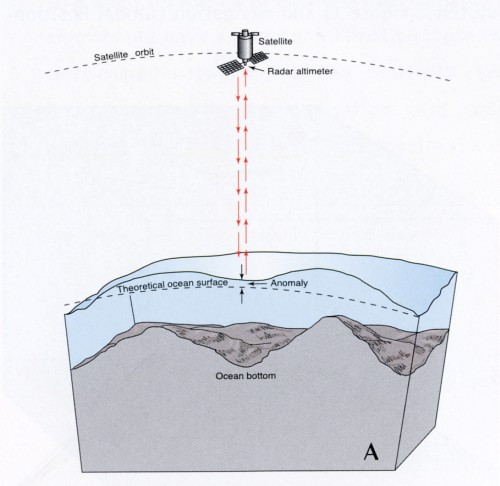
An Earth-orbiting radar in space cannot see the ocean bottom, but it can measure ocean surface height variations induced by ocean floor topography. The image above (A) shows how sea surface height can be measured from space.
A mountain on the ocean floor adds to the pull of Earth’s gravity and changes its direction subtly, causing extra water to pile up around the mountain. For example, a mountain on the ocean floor that is 2000 m tall produces a sea surface bump only 20 cm tall. Though small, this is measurable from space. The ultimate resolution of this method is limited by regional ocean depth. The schematic image below (B) shows the induced sea surface slope produced by a seamount on the ocean floor.
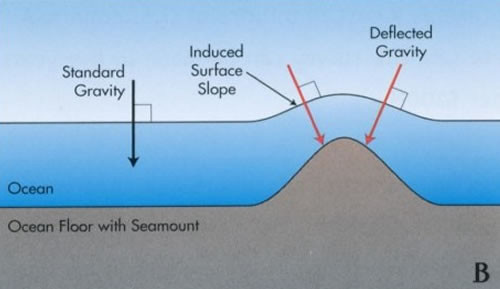
The tilt in the direction of gravity, called a 'deflection of the vertical', is equal to the slope of the sea surface, and is measured in microradians. One microradian of deflection appears as a 1 mm change in sea surface height per 1 km of horizontal distance.
However, there are some limitations in the correlation between gravity and bathymetry data. This can be influenced by sub-seafloor geology and variations in sediment thickness, i.e. with the original shape of the seafloor has been buried by the accumulation of sediment. Areas may be draped in sediment and gravity data may be capturing the 'buried' terrain.
Longer wavelength bathymetry is limited by isostasy and shorter wavelength to upward continuation.
Correlation is therefore stronger over rough topography in deeper ocean where sediment cover is thinner and weaker on continental margins and abyssal plains.
For more information:
- Oceanography magazine, volume 17, March 2004, Special issue: Bathymetry from Space
How are maps of the ocean floor made?
Traditionally this was done by drawing up a blank worksheet that covered the area of interest and then plotting the depth points at their appropriate locations in terms of latitude and longitude.
Until the 20th century there were so few depths recorded that almost all ocean depths were recorded as strings of numbers stretching across otherwise almost blank charts. With the advent of acoustic data recording in the 1930's the volume of soundings (as depth measurement are most commonly called) has increased phenomenally such that with increasing frequency survey tracks began to cross each other. Bathymetric contour lines, i.e. lines of equal depth, could then be drawn from the plotted depths.
Below is an example of a traditional plotting sheet covered in numbers (depths) at the locations where they were measured.
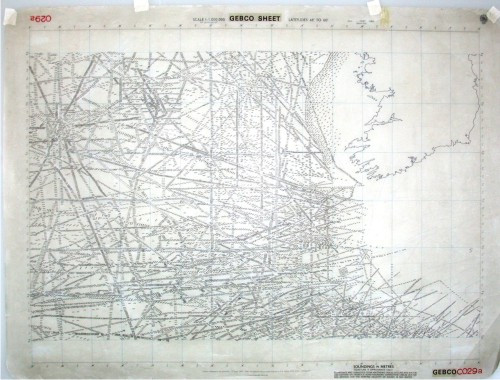
From these points a bathymetric contour map was produced. GEBCO used such sheets for the compilation of all its maps up to and including the 5th Edition which was published between 1975 and 1982.
Find out more about how bathymetry data are collected.
Using digital bathymetry data a 3D grid or terrain model can be made from the data. As discussed above, in regions of sparse data coverage satellite-derived gravity data can be used to help the guide the interpolation of depth values between the measured sounding points.
Creating a bathymetric grid
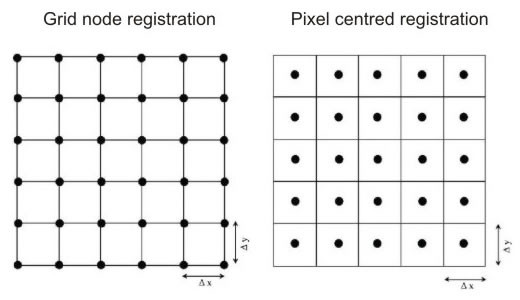
Bathymetric grids consist of data arranged in a 'grid' of cells. The majority of grids are structured so that all cells have exactly the same dimensions. However, some grids have cells of varying size and/or shape.
GEBCO's gridded data sets consist of grid cells at equally spaced intervals of longitude and latitude.
The images below show the arrangement of cells for a regular grid. The data values refer to the grid 'nodes', shown as black dots. Grid registration refers to the location of these nodes. Grid line registration means that nodes are centred on the intersection of the grid lines. Pixel centred registration means that the nodes are centred in the grid cells.
Ideally each cell would be based on a measured depth value. However, as discussed above, the world's oceans have not been fully surveyed by conventional echo-sounders. Therefore some of the grid cells may contain 'interpolated' values, i.e. a computer program has estimated what a reasonable value would be to assign to the cell based on the nearest measured depth values. These computer programs use 'gridding algorithms'.
From the gridded data sets, computer software packages can be used to model the terrain in 3D.
When creating a bathymetric grid, the first task is to carry out quality control work on the digital bathymetric sounding data sets to check for errors in positioning and depth measurement, which may show up as 'spikes' in the data set. An iterative process may then take place of gridding the data, carrying out checks on the resultant grid and then making any necessary corrections to the source data (e.g. removing 'bad' soundings) before re-gridding the data.
Please see the IHO-IOC GEBCO Cook Book for further information on developing bathymetric grids.
Using bathymetric soundings and satellite-derived gravity data to create a bathymetric grid
In areas of sparse sounding data coverage, satellite-derived gravity data can be used to help model the shape of the ocean floor, creating a grid of 'predicted' bathymetry.
The following details the method used to create a gridded data set using a database of ship-track soundings with interpolation between the soundings guided by predicted bathymetry. This process has been referred to as 'polishing'.
Initially, the predicted bathymetric grid is used to quality control the ship-track soundings database, looking for obvious errors in the data set, such as data 'spikes'.
To generate the combined predicted bathymetry and ship-track sounding grid, the value of the predicted bathymetry at the position of each measured sounding is subtracted from the sounding value, the difference is interpolated using a gridding routine. The value of the predicted bathymetry is added back to the interpolated difference. The result is a polished grid that passes smoothly through each median sounding and has the value of the predicted bathymetry far from the sounding.
References
- Becker, J. J., D. T. Sandwell, W. H. F. Smith, J. Braud, B. Binder, J. Depner, D. Fabre, J. Factor, S. Ingalls, S-H. Kim, R. Ladner, K. Marks, S. Nelson, A. Pharaoh, R. Trimmer, J. Von Rosenberg, G. Wallace, P. Weatherall., Global Bathymetry and Elevation Data at 30 Arc Seconds Resolution: SRTM30_PLUS, Marine Geodesy, 32:4, 355-371, 2009 DOI: 10.1080/01490410903297766
- W.H.F. Smith and D.T. Sandwell, Global Sea Floor Topography from Satellite Altimetry and Ship Depth Soundings, Science, VOL. 277, 26 September 1997
Please see the IHO-IOC GEBCO Cook Book for further information on developing bathymetric grids.
What does 'resolution' mean?
In ocean bathymetry, we use the term resolution to describe the level of detail that can be seen using various types of acoustic sounding.
There two components of resolution that are of prime importance, these are vertical and horizontal. The vertical component of bathymetric measurement deals with the absolute depth values that are recorded, while the horizontal component deals with the spatial separation between recorded depth soundings.
What are grid artifacts?
In terms of bathymetry, artifacts are distortions or other types of error that may appear in the gridded set. They may be produced by some form of processing error. This may occur in the primary data collection when the data are being processed to remove extraneous noise or during the gridding process.
We maintain a list of reported bugs for GEBCO's gridded data sets.
How do we know what areas show measured depths of the seabed and what areas are 'predicted'?
When viewing the GEBCO Grid, there will be some areas that seem to show a much higher detail, and other areas that are relatively 'smooth'. Generally speaking, it is the smoother areas that are predicted whereas the areas of greatest detail are usually well-constrained by data.
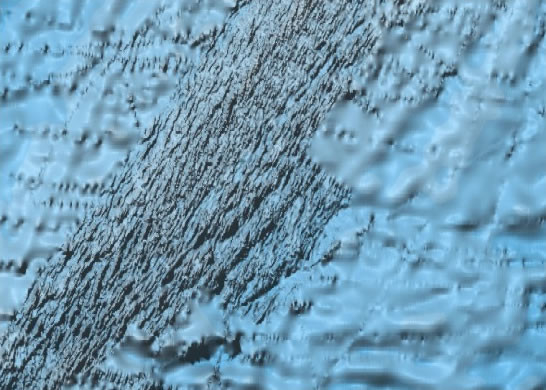
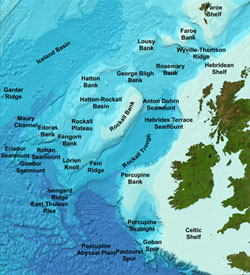
Above is an image showing a section of the bathymetry of the Reykjanes Ridge to the southeast of Iceland, note the apparent 'sharpness' of detail in the region running NE-SW, (which shows sub-sampled multibeam bathymetry data) compared to the much smoother areas to the southeast. There are a few thin 'stripes' or lines over this southeastern area and they represent single-beam echo-sounding lines that were used to constrain the satellite-predicted bathymetry.
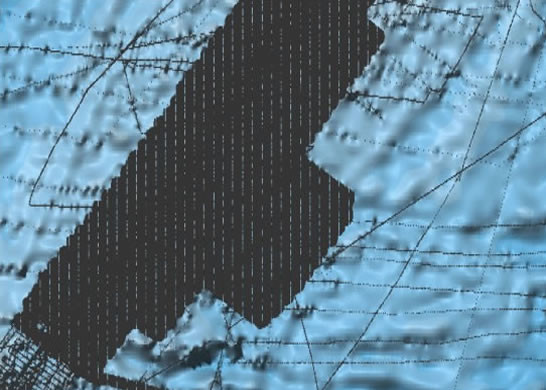
The image below shows the same area as above, but displays the 'control' or real data points that were used (in black). The depths of the areas between the lines were predicted using sea-surface deflections as described above in the section describing how you can measure the depth of the ocean from space.
The GEBCO Type Identifier (TID) Grid accompanies the GEBCO_2020 Grid. It identifies the type of source data that grid cells in the GEBCO_2020 Grid are based on. The grid can be downloaded from the web.
Useful links
Use the links below to find out more information about the bathymetry data and the ocean floor.
- Dive and Discover from Woods Hole Oceanographic Institution.
- Educational resources from the US National Centers for Environmental Information
- Learning and teaching from the UK National Oceanography Centre
- Outreach from the Center for Coastal and Ocean mapping at the University of Durham, New Hampshire
- NOAA educational resources - from the US National Oceanic and Atmospheric Administration (NOAA)