
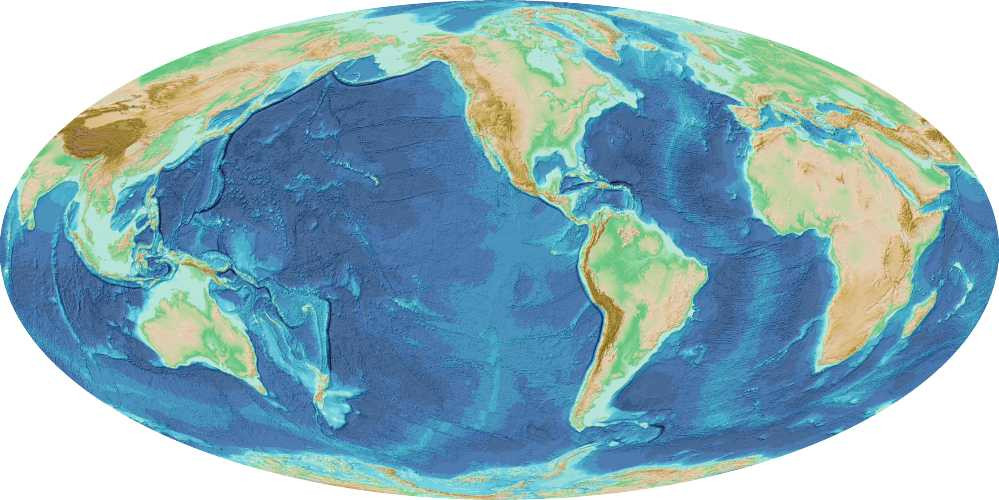
The GEBCO_2021 Grid is a global terrain model for ocean and land, providing elevation data, in meters, on a 15 arc-second interval grid. It includes a number of additonal data sets compared to the GEBCO_2020 Grid.
The grid is accompanied by a Type Identifier (TID) Grid, giving information on the types of source data that the GEBCO_2021 Grid is based on.
The primary GEBCO_2021 grid contains land and ice surface elevation information - as provided for previous GEBCO grid releases. In addition, for the 2021 release, we have made available a version with under-ice topography/bathymetry information for Greenland and Antarctica.
Please see the accompanying documentation for more information
(1 MB).
Introduction
The GEBCO_2021 Grid provides global coverage of elevation data in meters on a 15 arc-second grid of 43200 rows x 86400 columns, giving 3,732,480,000 data points.
The data are available to download according to the Terms of Use provided below.
GEBCO Type Identifier (TID) Grid
The GEBCO Grid is accompanied by a Type Identifier (TID) grid. This data set identifies the type of source data that the corresponding grid cells in the GEBCO Grid are based on. Further information about the format and coding of the TID grid is given below.
| TID | Definition |
|---|---|
| 0 | Land |
| Direct measurements | |
| 10 | Singlebeam - depth value collected by a single beam echo-sounder |
| 11 | Multibeam - depth value collected by a multibeam echo-sounder |
| 12 | Seismic - depth value collected by seismic methods |
| 13 | Isolated sounding - depth value that is not part of a regular survey or trackline |
| 14 | ENC sounding - depth value extracted from an Electronic Navigation Chart (ENC) |
| 15 | Lidar - depth derived from a bathymetric lidar sensor |
| 16 | Depth measured by optical light sensor |
| 17 | Combination of direct measurement methods |
| Indirect measurements | |
| 40 | Predicted based on satellite-derived gravity data - depth value is an interpolated value guided by satellite-derived gravity data |
| 41 | Interpolated based on a computer algorithm - depth value is an interpolated value based on a computer algorithm (e.g. Generic Mapping Tools) |
| 42 | Digital bathymetric contours from charts - depth value taken from a bathymetric contour data set |
| 43 | Digital bathymetric contours from ENCs - depth value taken from bathymetric contours from an Electronic Navigation Chart (ENC) |
| 44 | Bathymetric sounding - depth value at this location is constrained by bathymetric sounding(s) within a gridded data set where interpolation between sounding points is guided by satellite-derived gravity data |
| 45 | Predicted based on helicopter/flight-derived gravity data |
| 46 | Depth estimated by calculating the draft of a grounded iceberg using satellite-derived freeboard measurement. |
| Unknown | |
| 70 | Pre-generated grid - depth value is taken from a pre-generated grid that is based on mixed source data types, e.g. single beam, multibeam, interpolation etc. |
| 71 | Unknown source - depth value from an unknown source |
| 72 | Steering points - depth value used to constrain the grid in areas of poor data coverage |
GEBCO Grid, vertical and horizontal datum
The complete GEBCO_2021 data set provides global coverage, spanning 89° 59' 52.5''N, 179° 59' 52.5''W to 89° 59' 52.5''S, 179° 59' 52.5''E on a 15 arc-second geographic latitude and longitude grid.It consists of 43200 rows x 86400 columns, giving 3,732,480,000 data points. The data values are pixel-centre registered i.e. they refer to elevations, in meters, at the centre of grid cells.
The GEBCO grid can be assumed to be relative to WGS84.
GEBCO's global elevation models are generated by the assimilation of heterogeneous data types, assuming all of them to be referred to Mean Sea Level. However, in some shallow water areas, the grids include data from sources having a vertical datum other than mean sea level.
Data Dissemination
CF-compliant NetCDF format
The GEBCO_2021 NetCDF files are provided in NetCDF 4 format and conform to the NetCDF Climate and Forecast (CF) Metadata Convention v1.6 (http://cfconventions.org/).
Within the NetCDF files, the GEBCO_2021 gridded data are stored as a two-dimensional array of 2-byte integer values of elevation in metres, with negative values for bathymetric depths and positive values for topographic heights. The GEBCO_2021 TID grid is provided in the NetCDF format, but data are stored as a two-dimensional array of single byte integers.
- The global dataset is provided as a single 7.5 GB file
- The global TID grid is provided as a single 4 GB file
Data contributors
| Contributing Project/Organization | Regional Data Set (including reference/link where available) |
|---|---|
| Alaska Fisheries Science Center of the US National Oceanic and Atmospheric Administration's National Marine Fisheries Service (NOAA Alaskan Fisheries) | Bathymetry data from the Alaska bathymetry compilations for the Aleutian Islands, central Gulf of Alaska and Norton Sound. https://www.fisheries.noaa.gov/alaska/ecosystems/alaska-bathymetry-sediments-and-smooth-sheets Digitized chart soundings, Alaska: Proofed digitized historical chart soundings from “smooth sheets” covering Alaskan waters Proofed digitized historical chart soundings from “smooth sheets” covering Alaskan waters. Zimmermann, M., Prescott, M. M. & Haeussler, P. J. Bathymetry and Geomorphology of Shelikof Strait and the Western Gulf of Alaska. Geosciences 9, 409, doi:doi:10.3390/geosciences9100409 (2019). Prescott, M. M. & Zimmermann, M. Smooth sheet bathymetry of Norton Sound. Report No. Memo. NMFS-AFSC-298, 23 (U.S. Department of Commerce, 2015). Zimmermann, M. & Prescott, M. M. Smooth sheet bathymetry of Cook Inlet, Alaska. Report No. Memo. NMFS-AFSC-275, 32 (U.S. Department of Commerce, 2014). Zimmermann, M., Prescott, M. M. & Rooper, C. N. Smooth sheet bathymetry of the Aleutian Islands. Report No. Memo. NMFS-AFSC-250, 43 (U.S. Department of Commerce, 2013). |
| AusSeabed, Australia | Beaman, R. 2018. High-resolution depth model for Northern Australia - 30 m., Geoscience Australia, Canberra. http://dx.doi.org/10.4225/25/5b35b3b8074a9 Grided multibeam bathymetry data sourced from AusSeabed in the Indian Ocean region https://portal.ga.gov.au/ |
| British Antarctic Survey (BAS), UK | Bathymetric compilations A bathymetric and topographic compilation of the South Sandwich Island Volcanic Arc, BAS GEOMAP 2 series https://doi.org/10.5285/b8143952-421c-4544-8437-58f339253d30 Compilation of a new bathymetric dataset of South Georgia. Antarctic Science 21, 171-174 https://doi.org/10.1017/S0954102008001703 Fremand, A.C. (2019) and Barnes, D. A bathymetric compilation of Ascension Island, 2000-2017. UK Polar Data Centre, Natural Environment Research Council, UK Research & Innovation. https://doi.org/10.5285/afba710f-dab1-4a63-867b-520177388224 Land elevation data and terrain models for areas in the Southern Ocean: South Georgia and South Sandwich Islands: From the South Georgia GIS https://www.sggis.gov.gs/ Marion Island: digitized from Very High Resolution (VHR) satellite imagery Balleney Island: digitized from Landsat imagery Bouvet and Peter Island: Norwegian Polar Institute (2014). Kartdata Bouvetøya 1:20 000 (B20 Kartdata); Norwegian Polar Institute (2014). Map data / kartdata Peter I Øy 1:50 000 (P50 Kartdata) |
| Bureau of Ocean Energy Management (BOEM), USA | Northern Gulf of Mexico Deepwater Bathymetry Grid from 3D Seismic https://www.boem.gov/Gulf-of-Mexico-Deepwater-Bathymetry/ |
| Canadian Hydrographic Service, Canada | Non-Navigational (NONNA-100) Bathymetric Data: represents all currently validated, digital bathymetric sources acquired by CHS, combined at a resolution of approximately 100 metres. Contains information licensed under the Open Government Licence – Canada. https://open.canada.ca/data/en/dataset/d3881c4c-650d-4070-bf9b-1e00aabf0a1d |
| Deakin University, Australia | Seafloor mapping data, Victoria – 10m grid Collation of seafloor structure information (bathymetry and softness hardness) collected using multibeam sonar systems as part of the Victorian Marine Habitat Mapping Project and bathymetric light detection and ranging data (LiDAR) collected as part of the future coats program. The geographic is Victorian State waters. http://dro.deakin.edu.au/view/DU:30043228 |
| Deep Reef Explorer (www.deepreef.org) | A high-resolution depth model for the Great Barrier Reef and Coral Sea Beaman, R.J., 2010. Project 3D-GBR: A high-resolution depth model for the Great Barrier Reef and Coral Sea. Marine and Tropical Sciences Research Facility (MTSRF) Project 2.5i.1a Final Report, MTSRF, Cairns, Australia, pp. 13 plus Appendix 1. https://www.deepreef.org/bathymetry/65-3dgbr-bathy.html |
| Directorate of Navigation and Hydrography Brazil | Bathymetric models March 2021 Brazilian Digital Terrain Model developed based on all available bathymetric data within the Brazilian Continental Margin. https://link.springer.com/article/10.1007/s00367-019-00606-x Alberoni, A. A. L., Jeck, I. K., Silva, C. G., & Torres, L. C. (2020). The new Digital Terrain Model (DTM) of the Brazilian Continental Margin: detailed morphology and revised undersea feature names. Geo-Marine Letters, 40(6), 949-964 Bathymetric grid based on multibeam data. Data contributed by the Brazilian Navy in support of naming seafloor features (SCUFN 32), in the South Atlantic Ocean. |
| Durham University, Department of Geography, UK | Bathymetric grid off Angola Bathymetric grid based on multibeam survey data collected during RRS James Cook cruise JC209 in waters off Angola in the Atlantic Ocean |
| EMODnet | The EMODnet Digital Bathymetry (DTM) 2020 EMODnet Bathymetry Consortium (2020): EMODnet Digital Bathymetry (DTM). https://doi.org/10.12770/bb6a87dd-e579-4036-abe1-e649cea9881a |
| GEBCO / Nippon Foundation Indian Ocean Bathymetric Compilation Project, University of New Hampshire and its Center for Coastal and Ocean Mapping/Joint Hydrographic Center (UNH/CCOM-JHC), USA | Indian Ocean Bathymetric Compilation http://ccom.unh.edu/indian-ocean-bathymetric-compilation-project |
| Geersen, J., et al. | Gridded multibeam data Geersen, J., Klaucke, I., Behrmann, J. H., Kopp, H., Tréhu, A. M., Reichert, C. (2018): Multibeam bathymetry from SONNE cruises SO104 and SO244 and Marcus G. Langseth cruise MGL1610. PANGAEA, https://doi.org/10.1594/PANGAEA.893033 |
| Geological Survey of Israel | Bathymetric grids for the Black and Caspian Seas Hall, J K (2002). Bathymetric compilations of the seas around Israel I: The Caspian and Black Seas. Geological Survey of Israel, Current Research, Vol. 13, December 2002. |
| Geological Survey of Spain | Multidisciplinary Scientific Cruise to the Northern Mid-Atlantic Ridge and Azores Archipelago Somoza, L et al. (2020). https://doi.org/10.3389/fmars.2020.568035 |
| GEOMAR Helmholtz Centre for Ocean Research Kiel, Germany | Red Sea region: Gridded multibeam bathymetry from Poseidon cruise 408 and Pelagia cruises 64PE350 and 64PE351 within the Jeddah Transect Project.: Augustin, Nico; Feldens, Peter; Kwasnitschka, Tom; Schmidt, Mark; Al Farawati, Radwan; Basaham, Ali S (2016): High resolution bathymetry of the Red Sea Rift (1 arc-second) from POSEIDON cruise POS408 and PELAGIA cruises 64PE350 and 64PE351. PANGAEA, https://doi.org/10.1594/PANGAEA.860374 Multibeam bathymetry data from cruises MSM88 and M160 Geersen, Jacob (2019): Collated bathymetric data from convergent margins that experienced tsunami earthquakes. PANGAEA, https://doi.org/10.1594/PANGAEA.899049 |
| Geoscience Australia | Australian Bathymetry and Topography Grid, June 2009 ANZLIC unique identifier: ANZCW0703013116, Geoscience Australia. Whiteway, T, (2009). Australian Bathymetry and Topography Grid, June 2009. Scale 1:5000000. Geoscience Australia, Canberra. http://dx.doi.org/10.4225/25/53D99B6581B9A. 50m Multibeam Dataset of Australia 2018 Parums, R., Spinoccia, M. 2019. 50m Multibeam Dataset of Australia 2018. Geoscience Australia, Canberra. MBES datasets collected in 1989-2018. http://dx.doi.org/10.26186/5c63832e3ed8e Perth Canyon Marine Park Bathymetry - 40m Resolution Grid 40m Resolution Grid. Geoscience Australia, Canberra, http://dx.doi.org/10.4225/25/5b31704371761 Multibeam data Grid of multibeam data sourced from Geoscience Australia and held in the AusSeabed Bathymetry Holdings for 2019 MH370 - Phase One Data Release http://marine.projects.ga.gov.au/mh370-phase-one-data-release.html High-resolution depth model for the Great Barrier Reef - 30 m Beaman, R.J. 2017. High-resolution depth model for the Great Barrier Reef - 30 m. Geoscience Australia, Canberra http://dx.doi.org/10.4225/25/5a207b36022d2 |
| Global Multi-resolution Topography Data Synthesis (GMRT), USA | GMRT versions 3.9 and 3.8 A multi-resolutional compilation of multibeam sonar data collected by scientists and institutions worldwide, that is edited, processed and gridded by the GMRT Team. This global multibeam compilation is merged into a continuously updated compilation of global elevation data. The GMRT multibeam compilation was provided to GEBCO at 15 arc sec resolution. The full list of contributing cruises, vessels and Chief Scientists is available at https://www.gmrt.org/contributors/cruises.php. https://www.gmrt.org/ |
| Global Sea Mineral Resources NV (GSR), DEME Group, Belgium | Bathymetric grid, based on multibeam data Supplied to GEBCO for a region of the North Pacific, 1800 km southwest of the Mexican Baja Peninsula. |
| GNS Sciences, New Zealand | Romney and Vulcan 3D Seismic bathymetry grid 50m grid Bathymetric grid from processed 3D seismic data from the Romney and Vulcan prospect areas. |
| Goodliffe, A. | Woodlark Basin multibeam bathymetry grid – 200m Goodliffe, A. (2011). Woodlark Basin multibeam bathymetry grid. Interdisciplinary Earth Data Alliance (IEDA). doi:10.1594/IEDA/100015 |
| Henstock, T.J. et al | Gridded bathymetric data set based on multibeam data from HMS Scott cruise HI1123 Seafloor morphology of the Sumatran subduction zone: Surface rupture during megathrust earthquakes? Geology, v34, pp485-488, 2006 |
| Hydrographic Service for the Navy, Ministry of the Defence of Argentina | Bathymetry data in the South Atlantic region Data collected aboard R/V Bio Hesperides, 2008 Bathymetric grids based on data acquired during the cruise campaigns: ARG-MD_2007 (2007), HES-2008-COOPERACION (2008), HE-2016 (2016) and the recovery of the A.R.A SAN JUAN submarine (2017) |
| Hydrographic Service of the Royal Netherlands Navy | Hydrographic Service of the Royal Netherlands Navy Areas of responsibility are the waters of the Kingdom of the Netherlands in the Caribbean, Islands: Aruba, Curaçao, Bonaire, Sint Maarten, Saba, Sint Eustatius. Sea. https://inspire.caris.nl/geoserver3/web/wicket/bookmarkable/org.geoserv…? |
| IceBridge BedMachine Greenland | IceBridge BedMachine Greenland, Version 3 Greenland under-ice topography/bathymetry gridded compilation. Gridded resolution is 150 × 150 m on a Polar Stereographic projection https://doi.org/10.1002/2017GL074954 http://nsidc.org/data/IDBMG4 Morlighem, M., et al. (2017), BedMachine v3: Complete Bed Topography and Ocean Bathymetry Mapping of Greenland From Multibeam Echo Sounding Combined With Mass Conservation, Geophysical Research Letters, 44(21), 11,051-011,061, doi:10.1002/2017GL074954 |
| Institut de physique du globe de Paris, France | Bathymetry grid of Pourquoi Pas? Cruise ILAB-SPARC, Chain Fracture Zone. https://doi.org/10.1594/PANGAEA.922975 |
| Institute of Marine Sciences (ISMAR) - CNR, Italy | Bathymetric grid for the Vema Transverse Ridge area P., Fabretti & Bonatti, Enrico & Peyve, A. & Brunelli, Daniele & Cipriani, Anna & Dobrolubova, X. & Efimov, V. & Erofeev, S. & Gasperini, Luca & Hanley, J.A. & Ligi, Marco & Perfiliev, A. & Rastorguyev, V. & Raznitsin, Yuri & Savel'eva, Savelyeva, Savelieva, Galina & Semjenov, V. & Sokolov, Sergey & Skolotnev, S. & Susini, Sara & Vikentev, I.. (1998). First results of cruise S19 (PRIMAR Project): petrological and structural investigations of the Vema Transverse Ridge (equatorial Atlantic). Giornale di Geologia. 60. 3-16. Bathymetric grid for the The Bouvet Tr1p1e Junction Region (south Atlantic) The Bouvet Tr1p1e Junction Region (south Atlantic): a report on two geological expeditions, ISMAR report, 2010; Carrara, G. (1); Bortoluzzi, G. (1); Zitellini, N. (1); Bonatti, E. (1); Brunelli, D. (2); Cipriani, A. (2); Fabretti, P. (1); Gasperini, L. (1); Ligi M. (1); Penitenti D. (1); Sciuto, P.F. (3); Mazarovich, A. (4); Peyve, A. (4); Turko T. (4); Skolotnev S. (4); Gilod D. (5); (1) IGM-ISMAR-CNR, Bologna, Italy; (2) Universita’ Padova, Italy; (3) Universita’ Genova, Italy; (4) GIN, Academy of Sciences, Russia; (5) Dep. Geophysics, Lomonosov University, Moscow, Russia |
| Istituto Nazionale di Oceanografia e di Geofisica Sperimentale (OGS), Infrastructures Division, Italy; Barcelona University (UB), Department of Earth and Ocean Dynamics, Spain; University of Bremen, MARUM – Center for Marine Environmental Sciences, Germany; University of Tromsø (UiT), Norway; The Arctic University of Norway, CAGE, Centre for Arctic Gas Hydrate; Italian Navy, Italian Hydrographic Institute | Bathymetric grid based on the following data sets: Multibeam bathymetry from EGLACOM cruise with RV OGS-Explora in 2008 to the western Barents Sea margin Multibeam bathymetry from SVAIS cruise with RV Hesperides 2007 to the western Barents Sea margin Multibeam bathymetry from DEGLABAR cruise with RV OGS-Explora in 2015 to the western Barents Sea margin Multibeam bathymetry from EDIPO cruise with RV OGS-Explora in 2015 to the western Barents Sea margin Multibeam bathymetry by MARUM from MSM30 (CORIBAR) cruise with RV M.S. Merian in 2013 to the western Barents Sea margin Multibeam bathymetry by University of Tromsø from Glacibar cruise with RV Jan Mayen in 2009 to the western Barents Sea margin Multibeam bathymetry by Italian Hydrographic Institute from High North 17 and 18 cruise with RV Alliance in 2017 and 2018 to the western Barents Sea margin |
| International Bathymetric Chart of the Arctic Ocean (IBCAO) | IBCAO bathymetric grid IBCAO v4 bathymetric grid, 180°W-180°E; 64°N-90°N doi:10.5285/a01d292f-b4a0-1ef7-e053-6c86abc0a4b2 Access a list of data sets included in the grid. |
| International Bathymetric Chart of the Southern Ocean (IBCSO) | IBCSO bathymetric grid, 180°W-180°E; 60S-90°S: The grid for the Southern Ocean area is based on the IBCSO V1 data base as documented in the source id list: https://www.scar.org/science/ibcso/resources/ Arndt, J E, H W Schenke, M Jakobsson, F Nitsche, G Buys, B Goleby, M Rebesco, F Bohoyo, J K Hong, J Black, R Greku, G Udintsev, F Barrios, W Reynoso-Peralta, T Morishita and R Wigley (2013). The International Bathymetric Chart of the Southern Ocean (IBCSO) Version 1.0 - A new bathymetric compilation covering circum-Antarctic waters. Geophysical Research Letters, doi: 10.1002/grl.50413 |
| Japan Aerospace Exploration Agency (JAXA) | Topography data for part of South America in the Southern Ocean region South of 50S and Franklin Island. ALOS Global Digital Surface Model https://www.eorc.jaxa.jp/ALOS/en/aw3d30/index.htm https://doi.org/10.5069/G94M92HB |
| Japan Agency for Marine-Earth Science and Technology (JAMSTEC) | 100m interval bathymetric grid for the Japan Trench region |
| Japan Coast Guard, Hydrographic and Oceanographic Department (JHOD); Japan Oceanographic Data Center (JODC) of the Japan Coast Guard | Japan Coast Guard Grid for the North Western Pacific Ocean Provided at 30 arc-second intervals, the grid for this area was originally developed from the following source data: Multibeam data from the Japan Coast Guard, A pre-prepared 500m interval grid based on measured sounding data: J-EGG500 grid JODC-Expert Grid data for Geographic -500m https://jdoss1.jodc.go.jp/vpage/depth500_file.html |
| Land Information New Zealand (LINZ) | Multibeam data used to compile New Zealand navigation charts Water around New Zealand. 80 gridded datasets (from various source data types) collected during hydrographic surveys (Tonga, Niue, Samoa) |
| Marine Geoscience Data System (MGDS), Hosted at Lamont-Doherty Earth Observatory of Columbia University, USA | Gridded multibeam data Data from 6 cruises in the South and West Pacific Ocean region. |
| MARUM – Center for Marine Environmental Sciences, University of Bremen, Germany | Bathymetric grids Bathymetric grids based on data recorded during RV MARIA S. MERIAN cruises MSM20-2 and MSM24 in 2012 & 2013 around Tristan da Cunha. Wintersteller, Paul; Kammann, Janina; Strack, Anne; Geissler, Wolfram H (2019): Composite Grid (DTM) and Backscatter Mosaics of EM120 and EM122 Multibeam Echosounder (MBES) Bathymetry of Cruises MSM20-2 and MSM24 around Tristan da Cunha. PANGAEA, https://doi.org/10.1594/PANGAEA.898303 Geersen, Jacob (2019): Collated bathymetric data from convergent margins that experienced tsunami earthquakes. PANGAEA, https://doi.org/10.1594/PANGAEA.899049, Supplement to: Geersen, J (2019): Sediment-starved trenches and rough subducting plates are conducive to tsunami earthquakes. Tectonophysics, 762, 28-44, https://doi.org/10.1016/j.tecto.2019.04.024 |
| MEaSUREs BedMachine Antarctica, Version 2 | Ice-surface elevation and under-ice topography/bathymetry Morlighem, M., E. Rignot, T. Binder, D. D. Blankenship, R. Drews, G. Eagles, O. Eisen, F. Ferraccioli, R. Forsberg, P. Fretwell, V. Goel, J. S. Greenbaum, H. Gudmundsson, J. Guo, V. Helm, C. Hofstede, I. Howat, A. Humbert, W. Jokat, N. B. Karlsson, W. Lee, K. Matsuoka, R. Millan, J. Mouginot, J. Paden, F. Pattyn, J. L. Roberts, S. Rosier, A. Ruppel, H. Seroussi, E. C. Smith, D. Steinhage, B. Sun, M. R. van den Broeke, T. van Ommen, M. van Wessem, and D. A. Young. 2020. Deep glacial troughs and stabilizing ridges unveiled beneath the margins of the Antarctic ice sheet, Nature Geoscience. 13. 132-137. https://doi.org/10.1038/s41561-019-0510-8 |
| National Institute of Water and Atmospheric Research Ltd (NIWA). Wellington, New Zealand | New Zealand Bathymetry compilation - 250 m Mitchell, J S, K A Mackay, H L Neil, E J Mackay, A Pallentin and P Notman (2012). Undersea New Zealand, 1:5,000,000. NIWA Chart, Miscellaneous Series No. 92 https://niwa.co.nz/our-science/oceans/bathymetry/download-the-data |
| National Geospatial-Intelligence Agency (NGA), USA | Bathymetric grids Bathymetry data in the form of grids based from NGA's data holdings.The supplied data set is at 6 arc-second intervals and is based on data from multiple cruises and data source types in all ocean regions. |
| National Oceanic and Atmospheric Administration (NOAA), USA | Bathymetric grids Grid of the United States Southeastern shelf exported from NCEI autogrid application. https://www.ngdc.noaa.gov/mgg/bathymetry/multibeam.html North American Great Lakes Bathymetry https://www.ngdc.noaa.gov/mgg/greatlakes/greatlakes.html Bathymetry and acoustic backscatter collected in Long Island Sound for the Phase I Long Island Sound Seafloor Mapping Project 2014 (NCEI Accession 0167946) https://www.ncei.noaa.gov/access/metadata/landing-page/bin/iso?id=gov.noaa.nodc:167946 |
| National Ocean Service, NOAA, USA | Bathymetric grids 6 Bathymetric grids based on multibeam data in the North Pacific region National Ocean Service Hydrographic Data Base (NOSHDB) and Hydrographic Survey Meta Data Base (HSMDB) Hydrographic Survey Data – for regions in the Gulf of Mexico and off the Eastern coast of the USA. https://www.ngdc.noaa.gov/mgg/bathymetry/hydro.html |
| Northeast Greenland Digital Bathymetric Model | Digital bathymetric model of Northeast Greenland (gridded compilation) Arndt, J. E., W. Jokat, B. Dorschel, R. Myklebust, J. A. Dowdeswell, and J. Evans (2015), A new bathymetry of the Northeast Greenland continental shelf: Constraints on glacial and other processes, Geochemistry, Geophysics, Geosystems, 16(10), 3733-3753, doi:10.1002/2015GC005931. |
| New South Wales Office of Environment and Heritage NSWOEH, Australia | NSW Office of Environment and Heritage (OEH) Multi-beam Bathymetry Surveys 42, 5m interval bathymetric grids based on multibeam data from bathymetry surveys carried out by the New South Wales Office of Environment and Heritage (Australia). https://catalogue-imos.aodn.org.au/geonetwork/srv/api/records/60160b01-8ffc-45ce-a6f4-ee70ce391ec6 |
| Norwegian Hydrographic Service (NHS) | Svalbard bathymetry grid based on multibeam bathymetry Released in 2016, this dataset includes modern multibeam data from surveys up until autumn 2015. Data is originally at 10x10 m, but down sampled to 100x100 m during the incorporation. https://www.kartverket.no/ |
| Norwegian Polar Institute (NPI) | Svalbard topography grid New topographical data of Svalbard with updated glacial fronts from satellite imaging. https://toposvalbard.npolar.no/ http://www.npolar.no/ |
| Ocean Networks Canada, Canada | Bathymetric grid Bathymetric grid based on multibeam data |
| Olex AS, Norway | Crowd source bathymetry data provided by Olex These data are primarily single beam soundings collected by fishing vessels using the Olex acquisition system. The data are provided gridded at a resolution of 400x400 m. www.olex.no |
| Pacific Islands Benthic Habitat Mapping Center (PIBHMC) | 65 gridded datasets, based on multibeam and satellite-derived bathymetry data collected around the Pacific Islands: Commonwealth of Northern Mariana Islands (CNMI) and Guam; Northwest Hawaiian Islands; Pacific Remote Island Area; American Samoa http://www.soest.hawaii.edu/pibhmc/cms/ |
| Polar Geospatial Center (PGC), University of Minnesota, USA | The Reference Elevation Model of Antarctica (REMA). The Cryosphere 13, 665-674, https://doi.org/10.5194/tc-13-665-2019 |
| Russian Academy of Sciences, Russia | Multibeam bathymetry data from the Kane Gap and south-eastern part of the Canary Basin (Eastern tropical Atlantic) https://doi.org/10.1016/j.dib.2020.106055 |
| School of Ocean and Earth Science and Technology at the University of Hawaii at Manoa, USA | Main Hawaiian Islands multibeam bathymetry http://www.soest.hawaii.edu/hmrg/multibeam/index.php |
| Scripps Institution of Oceanography, USA | SRTM15+ V2.2 Global Bathymetry and Topography at 15 Arcseconds This data set is a fusion of land topography with measured and estimated seafloor topography. This version of SRTM15+ is similar to version 2.1 [Tozer et al., 2019] with minor updates. Version 2.2 uses predicted depths based on the V29 gravity model [Sandwell et al., 2019] and approximately 400 small areas containing suspect data were visually identified and removed from the grid. https://doi.org/10.1029/2019EA000658. https://topex.ucsd.edu/WWW_html/srtm15_plus.html |
| GEBCO Sub-Committee on Undersea Feature Names (SCUFN) | Bathymetric data sets 32 bathymetric datasets submitted to SCUFN from China in support of undersea feature name proposals. |
| Service Hydrographique et Océanographique de la Marine (SHOM), France | Bathymetric data supplied in the form of grids Largely from multibeam and Lidar bathymetric surveys and transect cruises in areas of the Pacific, Atlantic and Indian Oceans, from the data holdings and cruises of SHOM. https://data.shom.fr/ Bathymetric DEM of the waters off Guyana, Atlantic Ocean https://diffusion.shom.fr/pro/risques/bathymetrie/mnt-facade-guyane-homonim.html Bathymetric DEM of Guadeloupe and Martinique https://diffusion.shom.fr/pro/risques/bathymetrie/mnt-facade-ants.html Bathymetric DEM of the facade of Saint-Martin and Saint-Barthélemy https://diffusion.shom.fr/pro/risques/bathymetrie/mnt-facade-antn.html |
| Shell Ocean Discovery XPRIZE | Data acquired as part of the Shell Ocean Discovery XPRIZE competition Data were contributed in an area in the Mediterranean Sea and near Puerto Rico. |
| South West Indian Ocean Bathymetry Compilation (SWIOBC) | The Southwest Indian Ocean Bathymetric Compilation (swIOBC) Dorschel, B, L Jensen, J E Arndt, G-J Brummer, H de Haas, A Fielies, D Franke, W Jokat, R Krocker, D Kroon, J Pätzold, R R. Schneider, V Spieß, H Stollhofen, G Uenzelmann‐Neben, M Watkeys and E Wiles (2018). The Southwest Indian Ocean Bathymetric Compilation (SwIOBC). Geochemistry, Geophysics, Geosystems 19, no. 3 (March 2018): 968–76. https://doi.org/10.1002/2017GC007274 |
| Taylor, Brian (2006) | Multibeam bathymetry compilation of the Lau Back-Arc Basin – 100m Taylor, B. (2006). Multibeam bathymetry compilation of the Lau Back-Arc Basin. Interdisciplinary Earth Data Alliance (IEDA). http://dx.doi.org/10.1594/IEDA/100063 |
| The quest for the Africa–Eurasia plate boundary west of the Strait of Gibraltar | Bathymetric grid based on multibeam data North Atlantic Ocean, Gulf of Cadiz region — SWIM project Reference: "Earthquake and Tsunami hazards of active faults at the South West Iberian Margin: deep structure, high-resolution imaging and paleoseismic signature". Data set citation — The quest for the Africa-Eurasia plate boundary west of the Strait of Gibraltar: Zitellini, N., Gràcia, E., Matias, L., Terrinha, P., Abreu, M.A., DeAlteriis, G., Henriet, J.P., Dañobeitia, J.J., Masson, D.G., Mulder, T., Ramella, R., Somoza, L. and Diez, S. (2009). Earth and Planetary Science Letters, 280, (1-4), 13-50. (doi:10.1016/j.epsl.2008.12.005) |
| University of Alaska Fairbanks and its College of Fisheries and Ocean Sciences, USA | Alaska Region Digital Elevation Model (ARDEM) Version 2.0 Danielson, S. L., E. L. Dobbins, M. Jakobsson, M. A. Johnson, T. J. Weingartner, W. J. Williams, and Y. Zarayskaya (2015), Sounding the northern seas, EOS 96, doi:10.1029/2015EO040975. |
| University of New Hampshire, Center for Coastal and Ocean Mapping/Joint Hydrographic Center, USA | United States Law of the Sea Data Atlantic Grid, version 2019. https://ccom.unh.edu/theme/law-sea/law-of-the-sea-data/atlantic Mendocino Ridge, Pacific Ocean https://ccom.unh.edu/theme/law-sea/mendocino-ridge-pacific-ocean Bering Sea - Beringian Margin https://ccom.unh.edu/theme/law-sea/beringian-margin-bering-sea Gulf of Alaska Margin https://ccom.unh.edu/theme/law-sea/gulf-alaska-margin Bering Sea Bowers Ridge https://ccom.unh.edu/theme/law-sea/bowers-ridge-bering-sea Necker Ridge, Pacific Ocean https://ccom.unh.edu/theme/law-sea/necker-ridge-pacific-ocean |
| University of Wisconsin, USA | Gridded multibeam bathymetry data from the Central Indian Ridge Drolia, R. and C. DeMets, (2019). Gridded multibeam bathymetry data from the Central Indian Ridge. IEDA. doi:10.1594/IEDA/324813 |
| United States Geological Survey (USGS) | One Meter Topobathymetric Digital Elevation Model for Majuro Atoll, Republic of the Marshall Islands Palaseanu-Lovejoy, M., Poppenga, S.K., Danielson, J.J, Tyler, D.J., Gesch, D.B., Kottermair, M., Jalandoni, A., Carlson, E., Thatcher, C., and Barbee, M. (2017) One Meter Topobathymetric Digital Elevation Model for Majuro Atoll, Republic of the Marshall Islands, 1944 to 2016: U.S. Geological Survey data release, r, and Matthew M. Barbee https://doi.org/10.3133/sir20185047 |
| United States Geological Survey (USGS); National Geospatial- Intelligence Agency (NGA), USA | Global Multi-resolution Terrain Elevation Data 2010 (GMTED2010) https://www.usgs.gov/core-science-systems/eros/coastal-changes-and-impacts/gmted2010?qt-science_support_page_related_con=0# |
| Weinrebe et al. | Multibeam compilation of the Central America Pacific Margin Weinrebe, W., et al. (2007). Multibeam bathymetry compilation of the Central America Pacific Margin. Interdisciplinary Earth Data Alliance (IEDA). doi:10.1594/IEDA/100069 |
| Weinrebe and Hasert | DTMs of the South East Pacific Ocean created from a compilation of multibeam bathymetric data acquired during 18 cruises in 1995-2012 Weinrebe, R.W., Hasert, M. (2012). Bathymetric Charts of the South East Pacific with links to gridded datasets. PANGAEA, https://doi.org/10.1594/PANGAEA.785515 |
| US-Extended Continental Shelf (ECS) cruises | Bathymetry data from the U.S. Extended Continental Shelf (ECS) Project https://www.ngdc.noaa.gov/mgg/ecs/cruises.html |
Multibeam and Single Beam Survey Data
| Source | Description and Reference (where available) |
|---|---|
| IHO DCDB | Bathymetric soundings, single beam and multibeam, extracted from the data maintained by the International Hydrographic Organization (IHO) Data Center for Digital Bathymetry (DCDB) at the US National Centers for Environmental Information (NCEI). https://www.ngdc.noaa.gov/iho/ |
| Alfred Wegener Institute (AWI), Germany | Multibeam data in the Atlantic and Indian Ocean region. More than 50 cruises of Multibeam data in the Arctic region North of 60N 6 cruises of multibeam data in the South and West Pacific. 59 cruises of multibeam data in the Southern Ocean region (South of 50°S) https://www.awi.de/en/ |
| All-Russia Research Institute of Geology and Mineral Resources of the World Ocean (VNIIOkeangeologia) | 2 cruises of multibeam data in the Southern Ocean region (South of 50°S). Data originators: Polar Marine Geosurvey Expedition (PMGE). |
| Australian Antarctic Data Centre (AADC) | 2 cruises of multibeam data and 11 cruises of single beam data in the Southern Ocean region (South of 50S). |
| AusSeabed, Australia | Multibeam data from around Australia http://www.ausseabed.gov.au/ |
| Australia's Marine National Facility (MNF) | 6 cruises of multibeam data in the Southern Ocean region (South of 50°S). |
| British Antarctic Survey (BAS), UK | 93 cruises multibeam data and 1 cruise of single beam data in the Southern Ocean region (South of 50°S). Multibeam bathymetry data from 24 cruises in the Arctic region North of 60N https://www.bas.ac.uk/ |
| Bundesanstalt für Geowissenschaften und Rohstoffe (BGR), Germany | 2 cruises multibeam data in the North Pacific Ocean region. |
| Capricorn Greenland Exploration A/S | Single beam bathymetry from two surveys in 2008 and 2009 |
| Canadian Hydrographic Service (CHS), Canada | Multibeam and single beam bathymetry from CCGS Louis St-Laurent: Single beam LSL2007: [Jackson, 2008] Jackson, H. R. (2008), Field report for 2007 the CCGS Louis S. St-Laurent seismic cruise to the Canada Basin, Geological Survey of Canada, Open File 5818, 143 pp. doi: 10.4095/297589 LSL2008: [Jackson and DesRoches, 2010] Jackson, H. R., and DesRoches, K. J. (2010), 2008 Louis S. St-Laurent Field Report, August 22 – October 3, 2008, Geological Survey of Canada, Open File 6275, 184 pp. doi:10.4095/285359. LSL2009: [Mosher et al., 2009] Mosher, D.C., Shimeld, J.D., and Hutchinson, D.R. (2009), 2009 Canada Basin seismic reflection and refraction survey, western Arctic Ocean: CCGS Louis S. St-Laurent expedition report, Geological Survey of Canada, Open File 6343, 266 pp. LSL2010: [Mosher et al., 2011] Mosher, D.C., Shimeld, J., and Champman, B.C., (2011), 2010 Canada Basin seismic reflection and refraction survey, western Arctic Ocean: CCGS Louis S. St-Laurent expedition report, Open File 6720, 240 pp. LSSL2011: [Mosher, 2012] Mosher, D. C. (2012), 2011 Canadian High Arctic Seismic Expedition: CCGS Louis S. StLaurent expedition report, Geological Survey of Canada, Open File 7053, 290 pp., doi: 10.4095/290241. Multibeam LSSL2014: [Travaglini, 2014] Travaglini, P. (2014), Final Field Report: Arctic Survey - UNCLOS 2014, CHSDIR Project Number 4013666, Dartmouth, Canadian Hydrographic Service, 82 pp. LSSL2015: Youngblut, S. (2015), Final Field Report: Amundsen Basin Survey: UNCLOS 2015, CHSDIR Project Number 4013733, Dartmouth: Canadian Hydrographic Service, 37 pp. LSSL2016: [Gårdfeldt and Lindgren, 2017] Gårdfeldt, K., and Å. Lindgren (2017), SWEDARCTIC Arctic Ocean 2016: Expedition ReportRep., 1-117 pp, Stockholm: Swedish Polar Research Secretariat. |
| ConocoPhillips | Single beam navigation data from Baffin Bay seismic surveys: No publications available Navigation data from 2D-seismic surveys for exploration of hydrocarbons in Baffin Bay, West Greenland, in 2012, conducted by Polarcus DMCC for ConocoPhillips. Released to and provided through Greenland Institute of Natural Resources for the purpose of preparation for publication in IBCAO/GEBCO |
| Centro de investigaciones Oceanograficas e Hidrograficas (CIOH), Colombia | 1 cruise of multibeam data in the Southern Ocean region (South of 50°S |
| Five Deeps Expedition/Caladan Oceanic | Multibeam bathymetry data collected in the North Pacific region as part of the Five Deeps Expedition https://fivedeeps.com/ |
| Fugro | 16 Cruises of Multibeam data in the Atlantic and Indian Ocean region. |
| Geological Survey of Canada (GSC), Canadian Hydrographic Service (CHS) | Multibeam bathymetry from Swedish icebreaker Oden acquired during the Lomonosov Ridge off Greenland (LOMROG) Expeditions 2007-2012 and East Greenland Ridge Expeditions (EAGER) 2011: LOMROG, 2007, Central Arctic Ocean: Jakobsson, M., Marcussen, C., and LOMROG, S. P., 2008, Lomonosov Ridge Off Greenland 2007 (LOMROG) - Cruise Report: Geological Survey of Denmark and Greenland. 122 pp. Jakobsson, M., et al. (2010), An Arctic Ocean ice shelf during MIS 6 constrained by new geophysical and geological data, Quaternary Science Reviews, 29(25–26), 3505-3517, doi:http://dx.doi.org/10.1016/j.quascirev.2010.03.015. LOMROG 2009, Central Arctic Ocean: Marcussen, C., and LOMROG II Scientific Party (2011), Lomonosov Ridge Off Greenland 2009 (LOMROG II) - Cruise ReportRep., 151 pp, Geological Survey of Denmark and Greenland, Ministry of Climate and Energy. LOMROG 2012, Central Arctic Ocean: Marcussen, C., F. Mørk, T. Funck, W. L. Weng, and M. Pedersen (2015), The continental shelf project of the kingdom of Denmark – Status and issues, in Geological Survey of Denmark and Greenland Bulletin, edited, pp. 41-44. Marcussen, C., and LOMROG III Scientific Party (2012), Lomonosov Ridge Off Greenland 2012 (LOMROG III) - Cruise ReportRep., 220 pp, Geological Survey of Denmark and Greenland, Geological Survey of Denmark and Greenland, Ministry of Climate and Energy. EAGER 2011, East Greenland Ridge: Marcussen, C., and EAGER 2011 Scientific Party (2011), East Greenland Ridge 2011 (EAGER) - Cruise ReportRep., 1-86 pp, Geological Survey of Denmark and Greenland, Ministry of Climate and Energy, Copenhagen. |
| Geological Survey of Denmark and Greenland (GEUS) | Single beam data acquired during seismic exploration surveys of the Greenland continental margin provided by GEUS: This contribution consists of >30 surveys carried out by various exploration companies for which the moratorium of the single beam bathymetry has expired. https://eng.geus.dk/ |
| Geological Survey of Denmark and Greenland (GEUS), Stockholm University and Swedish Polar Research Secretariat | Geological Survey of Denmark and Greenland (GEUS), Stockholm University and Swedish Polar Research Secretariat Multibeam bathymetry from Swedish icebreaker Oden acquired during the Lomonosov Ridge off Greenland (LOMROG) Expeditions 2007-2012 and East Greenland Ridge Expeditions (EAGER) 2011: LOMROG, 2007, Central Arctic Ocean: Jakobsson, M., Marcussen, C., and LOMROG, S. P., 2008, Lomonosov Ridge Off Greenland 2007 (LOMROG) - Cruise Report: Geological Survey of Denmark and Greenland. 122 pp. Jakobsson, M., et al. (2010), An Arctic Ocean ice shelf during MIS 6 constrained by new geophysical and geological data, Quaternary Science Reviews, 29(25–26), 3505-3517, doi:http://dx.doi.org/10.1016/j.quascirev.2010.03.015. LOMROG 2009, Central Arctic Ocean: Marcussen, C., and LOMROG II Scientific Party (2011), Lomonosov Ridge Off Greenland 2009 (LOMROG II) - Cruise ReportRep., 151 pp, Geological Survey of Denmark and Greenland, Ministry of Climate and Energy. LOMROG 2012, Central Arctic Ocean: [Marcussen and LOMROG III Scientific Party, 2012; Marcussen et al., 2015] Marcussen, C., F. Mørk, T. Funck, W. L. Weng, and M. Pedersen (2015), The continental shelf project of the kingdom of Denmark – Status and issues, in Geological Survey of Denmark and Greenland Bulletin, edited, pp. 41-44. Marcussen, C., and LOMROG III Scientific Party (2012), Lomonosov Ridge Off Greenland 2012 (LOMROG III) - Cruise ReportRep., 220 pp, Geological Survey of Denmark and Greenland, Geological Survey of Denmark and Greenland, Ministry of Climate and Energy. EAGER 2011, East Greenland Ridge: [Marcussen and EAGER 2011 Scientific Party, 2011] Marcussen, C., and EAGER 2011 Scientific Party (2011), East Greenland Ridge 2011 (EAGER) - Cruise ReportRep., 1-86 pp, Geological Survey of Denmark and Greenland, Ministry of Climate and Energy, Copenhagen. |
| Geological Survey of Sweden (SGU) | Hoburg’s shoal survey from 2016/2017: [Kågesten et al., 2019] Kågesten, G., Fiorentino, D., Baumgartner, F., and Zillén, L., 2019, How Do Continuous High-Resolution Models of Patchy Seabed Habitats Enhance Classification Schemes?: Geosciences, v. 9, no. 5, p. 237. doi.org/10.3390/geosciences9050237 https://www.sgu.se/samhallsplanering/hav-och-kust/stod-till-havsplaneri…- forvaltning/projekt-hoburgs-bank/ |
| Geological Survey of Denmark and Greenland (GEUS), Danish Geodata Agency | Multibeam bathymetry collected by Fugro for Demark’s extended continental shelf claim: No publication available |
| GEOMAR Helmholtz Centre for Ocean Research Kiel, Germany | Multibeam data from 15 cruises in the Arctic region north of 50N. https://www.geomar.de/en/centre/ |
| Geological Institute, Russian Academy of Sciences (GIN RAS) | Gridded bathymetry data from RV Akademik Nikolaj Strakhov Cruise 22 in the Atlantic Ocean Multibeam survey data from RV Akademik Nikolaj Strakhov Cruises 7 and 11-12 in the Atlantic ocean Multibeam data from four surveys with RV Akademik Nikolaj Strakhov of the Knipovich Ridge (Updated since IBCAO v3 with higher resolution): Zayonchek, A. V., et al. (2010), The Structure of Continent-Ocean transition zone at North- West Barents Sea Margin (results of 24–26th cruises of RV Akademik Nikolaj Strakhov, 2006-2009), in Contribution of Russia to International Polar Year, edited by M. Paulsen, pp. 111-157. Gridded multibeam bathymetric data from R/V Akademik Nikolaj Strakhov cruise 45 in the Atlantic Ocean, 2019. Transit from Vema Fracture Zone region to the Canary Islands. |
| Geoscience Australia | 2 cruises of multibeam data and 8 cruises of single beam data in the Southern Ocean region (South of 50°S). Tasman and Coral Seas bathymetry survey (FK201228/GA4868) – 64m grid 2021. http://pid.geoscience.gov.au/dataset/ga/145279 |
| Greenland Institute of Natural Resources (GINR) | Crowd source data and multibeam data provided through Greenland Institute of Natural Resources: These data include single beam soundings collected by GINR vessels Martek Aps, Kisaq, Greenland Police and Polar Seafood and multibeam bathymetry collected by Sanna in Nuup Kangerlua (Godthaabsfjord), Ameralik and Fyllas Bank of West Greenland in 2018. |
| Hawke’s Bay Regional Council (HBRC), New Zealand | 3 surveys of multibeam data from the Wairoa Hard and Clive Hard areas of Hawke Bay, New Zealand |
| L'Institut Français de Recherche pour l'Exploitation de la Mer (IFREMER), France | 3 cruises of multibeam data and 1 cruise of single beam data in the Southern Ocean region (South of 50°S). |
| Instituto Geologico y Minero de Espana (IGME), Spain | 10 cruises of multibeam data in the Southern Ocean region (South of 50°S). |
| Istituto Nazionale di Oceanografia e di Geofisica Sperimentale (OGS), Italy | 11 cruises of multibeam data in the Southern Ocean region (South of 50°S). |
| Italian Hydrographic Institute (IHI) | 1 cruise of single beam data in the Southern Ocean region (South of 50°S). |
| Japan Agency for Marine-Earth Science and Technology (JAMSTEC) | South and West Pacific Ocean region: 858 cruises of Multibeam data accessed through: Data and Sample Research System for Whole Cruise Information Southern Ocean region (South of 50°S): 7 cruises of multibeam data Multibeam bathymetry in the Arctic region North of 50N collected with Japanese RV Mirai: MR00_K06, MR02_K05, MR04_K05, MR99_K05 http://www.godac.jamstec.go.jp/darwin/e |
| Japanese Antarctic Research Expedition (JARE) | 4 cruise of single beam data in the Southern Ocean region (South of 50°S) |
| Japan Oceanographic Data Center (JODC) | 4 cruise of multibeam data in the Southern Ocean region (South of 50°S) |
| Korea Polar Research Institute (KOPRI) | Southern Ocean region (South of 50°S): 14 cruises of multibeam data Arctic Region, North of 50N: Multibeam data from Korean RV Araon expeditions: ARA02B and ARA03B: [Kang et al., 2012] Kang, S.-H., S.-i. Nam, J. H. Yim, K. H. Chung, and J. K. Hong (2012), Cruise Report: RV Araon ARA03BRep., 174 pp, Korea Polar Research Institute (KOPRI). ARA04C: No publication available https://eng.kopri.re.kr |
| Lamont-Doherty Earth Observatory, Columbia University, Earth Institute,USA | Southern Ocean region (South of 50°S): 10 cruises of single beam data. R/V Marcus G. Langseth expeditions. Multibeam bathymetry from R/V Marcus G. Langseth: MGL 1112, 2011, Chukchi Sea: [Coakley et al., 2011; Dove et al., 2014] Coakley, B., and Ilhan (2011), Abstract T33A-2365: Chukchi Edges Project – Geophysical constraints on the history of the Amerasia Basin, paper presented at American Geophysical Union Fall Meeting 2011, American Geophysical Union, San Francisco, 5-9 Dec. Dove, D., Polyak, L., and B. Coakley (2014), Widespread, multi-source glacial erosion on the Chukchi margin, Arctic Ocean, Quaternary Science Reviews, 92, 112–122, doi: 10.1016/j.quascirev.2013.07.016. MGL 1109, 2011, Gulf of Alaska: [Reece et al., 2013] Reece, R. S., Gulick, S. P. S., Christeson, G. L., Horton, B. K., van Avendonk, H., and Barth, G. (2013), The role of farfield tectonic stress in oceanic intraplate deformation, Gulf of Alaska, J. Geophys. Res. Solid Earth, 118, 1862–1872, doi:10.1002/jgrb.50177. |
| Lamont-Doherty Earth Observatory, Columbia University; Geological Survey of Denmark and Greenland (GEUS); Gardline Geosurvey Limited | Multibeam bathymetry data from cruises: EW9006 and EW9007 |
| Maersk | Single beam navigation data from Baffin Bay seismic surveys: No publication available Navigation data from 2D-seismic surveys for exploration of hydrocarbons in Baffin Bay, West Greenland, in 2012, conducted by Polarcus DMCC for Maersk Oil. Released to Greenland Institute of Natural Resources for the purpose of preparation for publication in IBCAO/GEBCO. |
| Marine Geoscience Data System (MGDS), Lamont-Doherty Earth Observatory, Columbia University, USA | 9 cruises of multibeam data in the South and West Pacific Ocean. |
| Marum - Center for Marine Environmental Sciences, University of Bremen (MARUM), Germany | Multibeam data from western Svalbard region (Vestnesa Ridge) with MARUM RV Heincke: [Mau et al., 2017] Mau, S., Römer, M., Torres, M., Bussmann, I., Pape, T., Damm, E. Geprägs, P., Wintersteller, P., Hsu, C.-W., Loher, M., and G. Bohrmann (2017), Widespread methane seepage along the continental margin off Svalbard - from Bjørnøya to Kongsfjorden. Scientific Reports 7, 42997, doi: 10.1038/srep42997 HE449: https://www.marum.de/en/Research/RV-HEINCKE-HE449-1-August-22-August-20… HE450: https://www.marum.de/en/Research/RV-HEINCKE-HE450-25-August-8-September… https://www.marum.de/en/index.html |
| Moscow State University; Geological Institute, Russian Academy of Sciences (GIN RAS); University of Tromso, Norway | Multibeam bathymetry data from RV Akademik Nikolaj Strakhov cruise TTR18. |
| Nansen Environmental and Remote Sensing Center, Norway | Single beam from RH SABVABAA (Hoovercraft) drifts in the central Arctic Ocean: Drifts in 2011 and in 2014/2015: [Kristoffersen and Hall, 2014] Kristoffersen, Y., and J. K. Hall (2014), Hovercraft as a Mobile Science Platform Over Sea Ice in the Arctic Ocean, Oceanography, 27(2), 170-179, doi:10.5670/oceanog.2014.33. |
| NASA-Ocean Melting Greenland project, Caltech’s Jet Propulsion Laboratory and the University of California Irvine, USA | NASA-Ocean Melting Greenland project, Caltech’s Jet Propulsion Laboratory and the University of California Irvine Multibeam bathymetry acquired by the Ocean Melting Greenland Project (OMG) 2013- 2018 along the coast of Greenland from airborne marine gravity and ship-based observations: [An et al., 2019a; An et al., 2017; An et al., 2019b; An et al., 2018; Fenty et al., 2016; Millan et al., 2018; Eric Rignot et al., 2015; E. Rignot et al., 2016a; E. Rignot et al., 2016b; Wood et al., 2018] An, L., Rignot, E., Millan, R., Tinto, K., & Willis, J. (2019a). Bathymetry of Northwest Greenland using “Ocean Melting Greenland” (OMG) high‐resolution airborne gravity and other data. Remote Sensing, 11(2), 131. An, L., Rignot, E., Mouginot, J., & Millan, R. (2018). A century of stability of Avannarleq and Kujalleq Glaciers, West Greenland, explained using high‐resolution airborne gravity and other data. Geophysical Research Letters, 45, 3156–3163. doi: 10.1002/2018GL077204 An, L., Rignot, E., Chauche, N., Holland, D., Holland, D., Jakobsson, M. et al. (2019b). Bathymetry of southeast Greenland from oceans melting Greenland (OMG) data. Geophysical Research Letters, 46, 11,197–11,205. doi: 10.1029/2019GL083953 An, L., E. Rignot, S. Elieff, M. Morlighem, R. Millan, J. Mouginot, D. M. Holland, D. Holland, and J. Paden (2017), Bed elevation of Jakobshavn Isbræ, West Greenland, from high- resolution airborne gravity and other data, Geophysical Research Letters, 44, doi:10.1002/2017GL073245. Fenty, I., et al. (2016), Oceans Melting Greenland: Early Results from NASA’s Ocean-Ice Mission in Greenland, Oceanography, 29(4), 71-83, doi:10.5670/oceanog.2016.100. Millan, R., Rignot, E., Mouginot, J., Wood, M., Bjørk, A. A., & Morlighem, M. (2018). Vulnerability of southeast Greenland glaciers to warm Atlantic water from operation IceBridge and ocean melting Greenland data. Geophysical Research Letters, 45, 2688– 2696. doi: 10.1002/2017GL076561. Rignot, E., Xu, Y., Menemenlis, D., Mouginot, J., Scheuchl, B., Li, X., et al. (2016a). Modeling of ocean‐induced ice melt rates of five west Greenland glaciers over the past two decades. Geophysical Research Letters, 43, 6374–6382. doi: 10.1002/2016GL068784. Rignot, E., I. Fenty, Y. Xu, C. Cai, I. Velicogna, C. Ó. Cofaigh, J. A. Dowdeswell, W. Weinrebe, G. Catania, and D. Duncan (2016b), Bathymetry data reveal glaciers vulnerable to ice-ocean interaction in Uummannaq and Vaigat glacial fjords, west Greenland, Geophysical Research Letters, 43(6), 2667-2674, doi:10.1002/2016GL067832. Rignot, E., I. Fenty, Y. Xu, C. Cai, and C. Kemp (2015), Undercutting of marine-terminating glaciers in West Greenland, Geophys. Res. Lett., 42, doi:10.1002/2015GL064236. Wood, M., Rignot, E., Fenty, I., Menemenlis, D., Millan, R., Morlighem, M., et al. (2018). Ocean‐induced melt triggers glacier retreat in Northwest Greenland. Geophysical Research Letters, 45, 8334–8342. doi: 10.1029/2018GL078024 https://omg.jpl.nasa.gov/portal/ |
| National Geospatial-Intelligence Agency (NGA), USA | 27 cruises of single beam data and one file of isolated soundings for the Southern Ocean region (South of 50°S). Single beam data from Melville Bay, Greenland, contributed by NGA: No metadata included on contribution |
| National Institute of Polar Research (Japan) (NiPR) | 4 cruises of multibeam data for the Southern Ocean region (South of 50°S). |
| National Institute of Water and Atmospheric Research (NIWA) (New Zealand) | 5 cruises of multibeam data for the Southern Ocean region (South of 50°S). 130 cruises of multibeam data from around New Zealand waters. Single beam data |
| Northeast Pacific Seamount Expedition project | Multibeam data from the EV “Nautilus” cruise NA097 |
| The Norwegian Petroleum Directorate (NPD) | Multibeam bathymetry collected on behalf of the Norwegian Petroleum Directorate: The multibeam mapping was carried out by Gardline Ltd. |
| Ocean Exploration Trust (OET), USA | Gridded multibeam data from 8 cruises of the EV “Nautilus” (2019) in the South and West Pacific region https://nautiluslive.org/expedition/2019 Multibeam data for 50 cruises in the North Pacific region https://nautiluslive.org/expedition-map |
| Polar Marine Geosurvey Expedition (PMGE), Russia | 1 cruise of multibeam and 28 cruises of single beam data for the Southern Ocean region (South of 50°S). |
| Rolling Deck to Repository (R2R), USA | Multibeam data from 134 cruises in the North Pacific region: https://www.rvdata.us/ |
| Schmidt Ocean Institute (SOI), USA | Multibeam data from 23 cruises in the North Pacific region: FK170602, FK170612, FK170825, FK180722, FK180731, FK180824, FK181005, FK181031,FK181210, FK190106, FK190211,FK190315,FK190612, FK190709, FK190726, FK190831, FK191005, FK140307, FK140418, FK140502, FK140613, FK140625, FK151005 https://schmidtocean.org/ |
| Scripps Institution of Oceanography (SIO), USA | 5 cruises of multibeam data in the North Pacific region VANC32MV, ALAR01RR, LPRS07RR, NECR06RR, SEAW06RR 1 cruise of multibeam data for the Southern Ocean region (South of 50°S). |
| Sea-Kit | Bathymetry data collected in the Atlantic Ocean, by the USV Maxliner, in 2020 as a part of the Two Oceans Two Technologies project. |
| Servicio Hidrografico y Oceanograficos de la Armada de Chile (SHOA). Chile | 1 cruise of single beam data for the Southern Ocean region (South of 50°S). |
| Shell | Single beam navigation data from Baffin Bay seismic surveys: No publication available Navigation data from 2D-seismic surveys for exploration of hydrocarbons in Baffin Bay, West Greenland, in 2012, conducted by Polarcus DMCC for Royal Dutch Shell. Released to Greenland Institute of Natural Resources for the purpose of preparation for publication in IBCAO/GEBCO. |
| South African Navy Hydrographic Office (SANHO), South Africa | 7 cruises of single beam data for the Southern Ocean region (South of 50°S). |
| Stanford University, USA | Multibeam bathymetry data from USCGC Healy cruises HLY 1101 HLY 1401 in the Arctic Ocean area north of 60N. |
| Statoil | One cruise of single beam bathymetry data in the Arctic Ocean area north of 60N. |
| State Oceanic Administration (SOA), China | 5 cruises of single beam data for the Southern Ocean region (South of 50°S). |
| Stockholm University, Sweden | 3 cruises of multibeam data for the Southern Ocean region (South of 50°S). |
| Swedish Polar Research Secretariat and Stockholm University | Swedish Polar Research Secretariat and Stockholm University Multibeam and single beam data from expeditions with Swedish icebreaker Oden: The LOMROG and EAGER expeditions are listed separately above. Single beam Arctic Ocean 1991, 1996, 2001: [Anderson et al., 1994; Björk et al., 2002; Jakobsson, 1999] Anderson, L. G., G. Björk, O. Holby, E. P. Jones, G. Kattner, K. P. Koltermann, B. Liljeblad, R. Lindegren, B. Rudels, and J. Swift (1994), Water masses and circulation in the Eurasian Basin: Results from Oden 91 Expedition, Journal of Geophysical Research, 99(C2), 3273- 3283. Björk, G., J. Söderkvist, P. Winsor, A. Nikolopoulos, and M. Steele (2002), Return of the cold halocline layer to the Amundsen Basin of the Arctic Ocean: Implications for the sea ice mass balance, Geophysical Research Letters, 29(11), 8-1-8-4, doi:10.1029/2001gl014157. Jakobsson, M. (1999), First high-resolution chirp sonar profiles from the central Arctic Ocean reveal erosion of Lomonsov Ridge sediments, Marine Geology, 158, 111-123. Multibeam AGAVE 2007: [Sohn et al., 2008] Sohn, R. A., et al. (2008), Explosive volcanism on the ultraslow-spreading Gakkel Ridge, Arctic Ocean, Nature, 453(26 June), 1236-1238, doi:10.1038/nature07075. NEGC 2008: Operated by Statoil A/S, no publication available SAT 2008, 2009: [Freire et al., 2014] Freire, F., R. Gyllencreutz, R. Jafri, and M. Jakobsson (2014), Acoustic evidence of a submarine slide in the deepest part of the Arctic, the Molloy Hole, Geo-Marine Letters(34), 315-325, doi:10.1007/s00367-014-0371-5. SWERUS-C3 2014 Expedition: [Jakobsson et al., 2016; The SWERUS Scientific Party, 2016a; b] The SWERUS Scientific Party (2016), Cruise Report for SWERUS-C3 Leg 1Rep., 200 pp, Bolin Centre for Climate Research, Stockholm. The SWERUS Scientific Party (2016), Cruise Report for SWERUS-C3 Leg 2Rep., 190 pp, Bolin Centre for Climate Research, Stockholm. Jakobsson, M., et al. (2016), Evidence for an ice shelf covering the central Arctic Ocean during the penultimate glaciation, Nature Communication, 7, 1-10, doi:10.1038/ncomms10365. Petermann 2015 Expedition: [Jakobsson et al., 2018; Mix et al., 2015] Jakobsson, M., et al. (2018), The Holocene retreat dynamics and stability of Petermann Glacier in northwest Greenland, Nature Communications, 9(1), 2104, doi:10.1038/s41467- 018-04573-2. Mix, A. C., M. Jakobsson, and Petermann-2015 Scientific Party (2015), Petermann-2015 Expedition Launches International Collaboration in Arctic Science, Witness the Arctic. Arctic Ocean 2016 Expedition: [Gårdfeldt and Lindgren, 2017] Gårdfeldt, K., and Å. Lindgren (2017), SWEDARCTIC Arctic Ocean 2016: Expedition ReportRep., 1-117 pp, Stockholm: Swedish Polar Research Secretariat. Ryder 2019 Expedition: [Jakobsson et al., submitted] Jakobsson, M., et al. (submitted), Seafloor and Atlantic water influence on Ryder Glacier, Northwestern Greenland, Science Advances. Oden Mapping data: https://oden.geo.su.se/ |
| Stockholm University, University of New Hampshire and Ola Skinnarmo | Multibeam bathymetry acquired in Melville Bay, west Greenland, during the VEGA- Greenland Expedition 2013, with SY Explorer of Sweden: [Freire et al., 2015] Freire, F., R. Gyllencreutz, S. L. Greenwood, L. Mayer, A. Egilsson, T. Thorsteinsson, and M. Jakobsson (2015), High resolution mapping of offshore and onshore glaciogenic features in metamorphic bedrock terrain, Melville Bay, northwestern Greenland, Geomorphology, 250, 29-40, doi: 10.1016/j.geomorph.2015.08.011. |
| TelePost Greenland A/S | Greenland Connect Nord multibeam bathymetry from south-west Greenland: No publication available Multibeam survey for offshore and inshore telecommunication cable from Nuuk to Aasiaat. Released to Greenland Institute of Natural Resources for the purpose of preparation for publication in IBCAO/GEBCO. |
| Ukraine Antarctic Expedition (UAE) | 13 cruises of single beam data for the Southern Ocean region (South of 50S). |
| University of New Hampshire, Center for Coastal and Ocean Mapping/Joint Hydrographic Center, USA | Multibeam bathymetry from U.S. Law of the Sea cruise to map the foot of the slope and 2500-m isobath of the US Arctic Ocean margin carried Center for Coastal and Ocean Mapping/Joint Hydrographic Center, University of New Hampshire: https://ccom.unh.edu/theme/law-sea/arctic-ocean HLY1603, HLY1202, HLY1102, HLY0905, HLY0805, HLY0703, HLY0302, HLY0405, HLY0503. Bathymetry are in addition provided from the following expeditions with USCGC Healy and RV Kilo Moana through the Center for Coastal and Ocean Mapping/Joint Hydrographic Center, or retrieved from the IHO-DCDB: HLY0201, HLY0203, HLY0204, HLY0304, HLY0303, HLY0402, HLY0403, HLY0404, HLY0501, HLY0502, HLY0602, HLY0804, HLY0806, HLY0904, HLY1002, KM0514-1/2 Multibeam bathymetry data from cruise: KM1718 Multibeam data collected aboard Kilo Moana from 15-Nov-17 to 21-Dec-17, Honolulu, HI to Honolulu, HI. NOAA National Centers for Environmental Information |
| University of Tasmania (UTAS), Australia | 1 cruise of single beam data and 1 file of isolated sounding data for the Southern Ocean region (South of 50S). |
| United States Geological Survey (USGS) | 1 cruise of single beam data for the Southern Ocean region (South of 50°S). 12 cruises of multibeam data in the North Pacific Ocean region: HLY17TC, HLY17TD, HLY17TD, HLY18TC, HLY18TD, HLY1104, HLY11TE, HLY13TC, HLY1403, HLY14TB, HLY14TD, HLY15TB Single beam data in the Arctic region North of 60N. |
| The University Centre in Svalbard (UNIS) | Multibeam bathymetry from Svalbard, from seven cruises with RV Helmer Hanssen: JM09H JM10: [Noormets et al., 2010] Noormets, R., Dowdeswell, J.A., Jakobsson, M. and Ó Cofaigh, C., 2010. New evidence on past ice flow and iceberg activity on the southern Yermak Plateau. American Geophysical Union, Fall Meeting, 13-17 December 2010, San Francisco, USA. HH11: [Fransner et al., 2018a] Fransner, O., Noormets, R., Chauhan, T., O’Regan, M.A. & Jakobsson, M., 2018. Late Weichselian ice stream configuration and dynamics in Albertini Trough, northern Svalbard margin. Arktos 4:1, 1-22. HH12: [Fransner et al., 2017] Fransner, O., Noormets, R., Flink, A.E. Hogan, K.A., Ó Regan, M.A. & Jakobsson, M., 2017. Glacial landforms and their implications for glacier dynamics in Rijpfjorden and Duvefjorden, northern Nordaustlandet, Svalbard. Journal of Quaternary Science 32, 437-455. Flink, A.E., Noormets, R., Fransner, O., Hogan, K.A., ÓRegan, M. and Jakobsson, M., 2017. Past ice flow in Wahlenbergfjorden and its implications for late Quaternary ice sheet dynamics in northeastern Svalbard. Quaternary Science Reviews 163, 162-179. HH13-NAL: [Fransner et al., 2018b] Fransner, O., R. Noormets, A. E. Flink, K. A. Hogan, and J. A. Dowdeswell (2018), Sedimentary processes on the continental slope off Kvitøya and Albertini troughs north of Nordaustlandet, Svalbard – The importance of structural-geological setting in trough-mouth fan development, Marine Geology, 402, 194-208, doi:https://doi.org/10.1016/j.margeo.2017.10.008. HH13-SF: [Lockwood, 2016] Lockwood, C. Reconstruction of ice stream retreat and palaeoceanographic development during the deglaciation and Holocene in the Storfjorden Trough, Svalbard. MSc Thesis in Marine geology and geophysics, University of Tromsø, 2016. HH14 No publication available https://www.unis.no/ |
| University of Maryland Center for Environmental Science (UMCES), USA | Multibeam bathymetry data from USCGC Healy cruises: HY1201 and HY1301 https://www.ngdc.noaa.gov/ships/healy/HLY1201_mb.html https://www.ngdc.noaa.gov/ships/healy/HLY1301_mb.html |
| University of New Brunswick, Ocean Mapping Group, Canada | Multibeam bathymetry acquired with Canadian CCGS Amundsen: Multibeam data from expeditions between 2003-2011 and 2013 are provided through the Ocean Mapping Group at University of New Brunswick separately from the NONNA-100 compilation where they also are included. http://www.omg.unb.ca/arctic-mapping/ |
| US Navy | Bathymetry from the Arctic region collected from US Navy nuclear submarines: Single beam USS Topeka, 2012 USS New Hampshire, 2011 USS Connecticut, 2011 Single beam released in batches with no connection to specific submarine 1992-2000; 1985-1992; 1958-1985, 2001-2005 Single beam from the SCICEX program 1993-1998, and swath bathymetry from 1999 SCICEX-93; USS Pargo SCICEX-95; USS Cavalla SCICEX-96; USS Pogy SCICEX-97; USS Archerfish SCICEX-98; USS Hawkbill SCICEX-99; USS Hawkbill (Swath bathymetry aquired with the SCAMP system, see main text) [Edwards and Coakley, 2003; Newton, 2000] Edwards, M. H., and B. J. Coakley (2003), SCICEX Investigations of the Arctic Ocean System, Chemie der Erde, 63(4), 281 - 328. Newton, G. B. (2000), The Science Ice Exercise Program: History, achievement, and future of SCICEX., Arctic Research of the United States, 14(fall/winter), 2-7 |
| Western Washington University, USA | Multibeam bathymetry data from RV Thomas G. Thompson cruise: TN250 https://www.ngdc.noaa.gov/ships/thomas_g_thompson/TN250_mb.html |
| Woods Hole Oceanographic Institution (WHOI), USA | Multibeam data from RV Knorr provided through WHOI Data Library and Archives: KN166-14, 2002, North Atlantic: No publication found Multibeam data from USCGC Healy cruises: HY 1103, HY 1203, HY 1303 and HY 1402 |
Other contributions
| Source | Description and Reference (where available) |
|---|---|
| Member States of the International Hydrographic Organization (IHO) | Bathymetric soundings extracted from Electronic Navigation Charts (ENCs) provided by IHO Member States. List of countries/organisations that have contributed ENC data directly to GEBCO: Australian Hydrographic Service (RAN); Australia Bundesamt fur Seeschifffahrt und Hydrographie, Germany; Directorate of Hydrography and Navigation, Peru; East Asia Hydrographic Commission; Finnish Hydrographic Office, Finland; Flemish Hydrography, Belgium; Hellenic Navy Hydrographic Service, Greece; Hydrographic service office of the Kingdom of Bahrain; Hydrographic Service, Maritime Administration of Latvia; Hydrographic Office of the Polish Navy, Poland; Hydrographic Office, South Africa; State Hydrographic Service of Ukraine; Royal Malaysian Navy Servicio de Hidrografía, Oceanografía; Meteorología y Cartografiado Náutico, Venezuela; Instituto Oceanographico de la Armada, Ecuador; Instituto Idrografico Della Marina, Italy; Instituto Hidrografico, Portugal; Korea Hydrographic and Oceanographic Administration, Korea (Republic of); National Hydrographic Office, India; National Ocean Service, USA; Netherlands Hydrographic Office, The Netherlands; Norwegian Mapping Authority, Norway; Servicio Hidrográfico y Oceanográfico de la Armada, Chile; Swedish Maritime Administration, Sweden; Centro De Hidrografia Da Marinha, Brazil; Uruguayan Navy Oceanography, Hydrography and Meteorology Service; Argentina; Hydrographic Department, Royal Thai Navy |
| Davey, F.J., 2004 | Ross Sea Bathymetry (1:200,000) Bathymetric map, Version 1.0, Institute of Geological and Nuclear Sciences, geophysical Map 16, GNS Ltd, Lower Hutt, New Zealand |
| Digitized depth contours from bathymetric maps | Contours digitized from published maps are used in the IBCAO Ver. 4 compilation where no other data are available: Cherkis, N. Z., H. S. Fleming, M. D. Max, P. R. Vogt, M. F. Czarnecki, Y. Kristoffersen, A. Midthassel, and K. Rokoengen (1991), Bathymetry of the Barents and Kara Seas, Bathymetry of the Barents and Kara Seas, Geological Society of America Map, Boulder. Scale 1:2,313,000 Matishov, G. G., N. Z. Cherkis, M. S. Vermillion, and S. L. Forman (1995), Bathymetry of the Franz Josef Land Area, Bathymetry of the Franz Josef Land area, Geological Society of America, Boulder, Colorado. Scale 1:500,000 Naryshkin, G. (1999), Bottom relief of the Arctic Ocean, Bathymetric contour map, Russian Academy of Sciences, St Petersburg. Scale 1:5,000,000 Naryshkin, G. (2001), Bottom relief of the Arctic Ocean, Bathymetric contour map, Russian Academy of Sciences. Scale 1:2,500,000 Perry, R. K., H. S. Fleming, J. R. Weber, Y. Kristoffersen, J. K. Hall, A. Grantz, G. L. Johnson, N. Z. Cherkis, and B. Larsen (1986), Bathymetry of the Arctic Ocean, Bathymetry of the Arctic Ocean, Boulder, Colorado. Scale 1:4,704,075 |
| The Head Department of Navigation and Oceanography (HDNO), Russia | Digital Bathymetric contours from charts Arctic region off Russia |
| Naval Oceanographic Office (NAVO), USA | Digital Bathymetric contours from charts Alaska area |
| Naval Research Laboratory, USA | Digital Bathymetric contours from charts |
| Stagpoole, V.M. et al, 2004 | Bathymetry of the Ross Dependency and adjacent Southern ocean 1:5,000,000, Version 1.0. Institute of Geological and Nuclear Sciences, Lower Hutt, New Zealand, geophysical map 17. GNS Ltd, Lower Hutt, New Zealand |
Data set attribution
If the data sets are used in a presentation or publication then we ask that you acknowledge the source.This should be of the form: GEBCO Compilation Group (2021) GEBCO 2021 Grid (doi:10.5285/c6612cbe-50b3-0cff-e053-6c86abc09f8f)
Terms of use and disclaimer
Scope
- These terms of use apply to The GEBCO Grid and other GEBCO-derived information products
- For brevity ‘The GEBCO Grid’ is used throughout and should be interpreted as meaning The GEBCO Grid and other GEBCO-derived information products
- Bathymetric Data refers to measurements made by various instruments of the ocean depth, associated ocean properties and the supporting metadata
- Information products are the result of applying algorithms, mathematical techniques, scientific theory and Intellectual Property to data to create useful, derived values
- As the GEBCO Grid is created by interpolating, applying algorithms and mathematical techniques to bathymetric data, GEBCO considers the GEBCO Grid to be an information product
- GEBCO does not provide the underlying source bathymetric data when distributing the GEBCO Grid
Terms of use
The GEBCO Grid is placed in the public domain and may be used free of charge.
Use of the GEBCO Grid indicates that the user accepts the conditions of use and disclaimer information given below.
Users are free to:
- Copy, publish, distribute and transmit The GEBCO Grid
- Adapt The GEBCO Grid
- Commercially exploit The GEBCO Grid, by, for example, combining it with other information, or by including it in their own product or application
Users must:
- Acknowledge the source of The GEBCO Grid. A suitable form of attribution is given in the documentation that accompanies The GEBCO Grid.
- Not use The GEBCO Grid in a way that suggests any official status or that GEBCO, or the IHO or IOC, endorses any particular application of The GEBCO Grid.
- Not mislead others or misrepresent The GEBCO Grid or its source.
Disclaimer
- The GEBCO Grid should NOT be used for navigation or for any other purpose involving safety at sea.
- The GEBCO Grid is made available 'as is'. While every effort has been made to ensure reliability within the limits of present knowledge, the accuracy and completeness of The GEBCO Grid cannot be guaranteed. No responsibility can be accepted by GEBCO, IHO, IOC, or those involved in its creation or publication for any consequential loss, injury or damage arising from its use or for determining the fitness of The GEBCO Grid for any particular use.
- The GEBCO Grid is based on bathymetric data from many different sources of varying quality and coverage.
- As The GEBCO Grid is an information product created by interpolation of measured data, the resolution of The GEBCO Grid may be significantly different to that of the resolution of the underlying measured data.
Reporting bugs in the GEBCO Grid
While every effort is made to produce an error free grid, some artefacts may still appear in the data set. Please see our errata page for information on known bugs in the dataset.
If you find any anomalies in the grid then please report them via email ( gdacc@seabed2030.org ), giving the problem location, and we will investigate.